************
Welcome to afex. For support visit: http://afex.singmann.science/
- Functions for ANOVAs: aov_car(), aov_ez(), and aov_4()
- Methods for calculating p-values with mixed(): 'S', 'KR', 'LRT', and 'PB'
- 'afex_aov' and 'mixed' objects can be passed to emmeans() for follow-up tests
- Get and set global package options with: afex_options()
- Set sum-to-zero contrasts globally: set_sum_contrasts()
- For example analyses see: browseVignettes("afex")
************
Attaching package: 'afex'
The following object is masked from 'package:lme4':

    lmer
library(tidyr)
Attaching package: 'tidyr'
The following objects are masked from 'package:Matrix':

    expand, pack, unpack
Data Description
The fictional data set is part of the data library of the JASP software, and is from the book by Field (2017)1. Here it only contains a subset of the data, where 10 men and 10 women for three speed-dating partners. All three partners were low in attractiveness (however defined), but varied in charisma: high, some, or none.
Data Import
charisma_data <-read.csv("charisma_ugly.csv")# Show the first six rowshead(charisma_data)
  participant gender ug_high ug_some ug_none
1         P01   Male      67      50      47
2         P02   Male      53      48      46
3         P03   Male      48      48      48
4         P04   Male      58      40      53
5         P05   Male      57      50      45
6         P06   Male      51      42      43
Mixed ANOVA
In R, one needs to first convert the data to a long format, so that each row represents an observation (instead of a person). In this data, there were 60 observations.
# First, convert to long format datalong_data <- tidyr::pivot_longer( charisma_data,cols = ug_high:ug_none,# name of IVnames_to ="charisma",# remove the "ug_" prefixnames_prefix ="ug_", # name of DVvalues_to ="rating")long_data
# A tibble: 60 × 4
   participant gender charisma rating
   <chr>       <chr>  <chr>     <int>
 1 P01         Male   high         67
 2 P01         Male   some         50
 3 P01         Male   none         47
 4 P02         Male   high         53
 5 P02         Male   some         48
 6 P02         Male   none         46
 7 P03         Male   high         48
 8 P03         Male   some         48
 9 P03         Male   none         48
10 P04         Male   high         58
# ℹ 50 more rows
Contrasts set to contr.sum for the following variables: gender
test_sphericity(mixed_anova)
Warning: Functionality has moved to the 'performance' package.
Calling 'performance::check_sphericity()'.
Warning in summary.Anova.mlm(object$Anova, multivariate = FALSE): HF eps > 1
treated as 1
OK: Data seems to be spherical (p > 0.612).
When one or more independent variable is a within-subject variable, mixed or repeated-measure ANOVA requires testing the assumption of sphericity. Here, the Mauchly’s test of sphericity provided insufficient evidence that the assumption of sphericity was violated, \(p = .612\).
Note that the result by default applies the Greenhousse-Geisser correction for violations of the sphericity assumption, but since the Mauchly’s test was not statistically significant, the results would be similar with or without the correction. Also note that the result here reports the generalized \(\eta^2\) (the ges column), which is different from some other software. See the documentation of the ?afex::nice page.
Plot
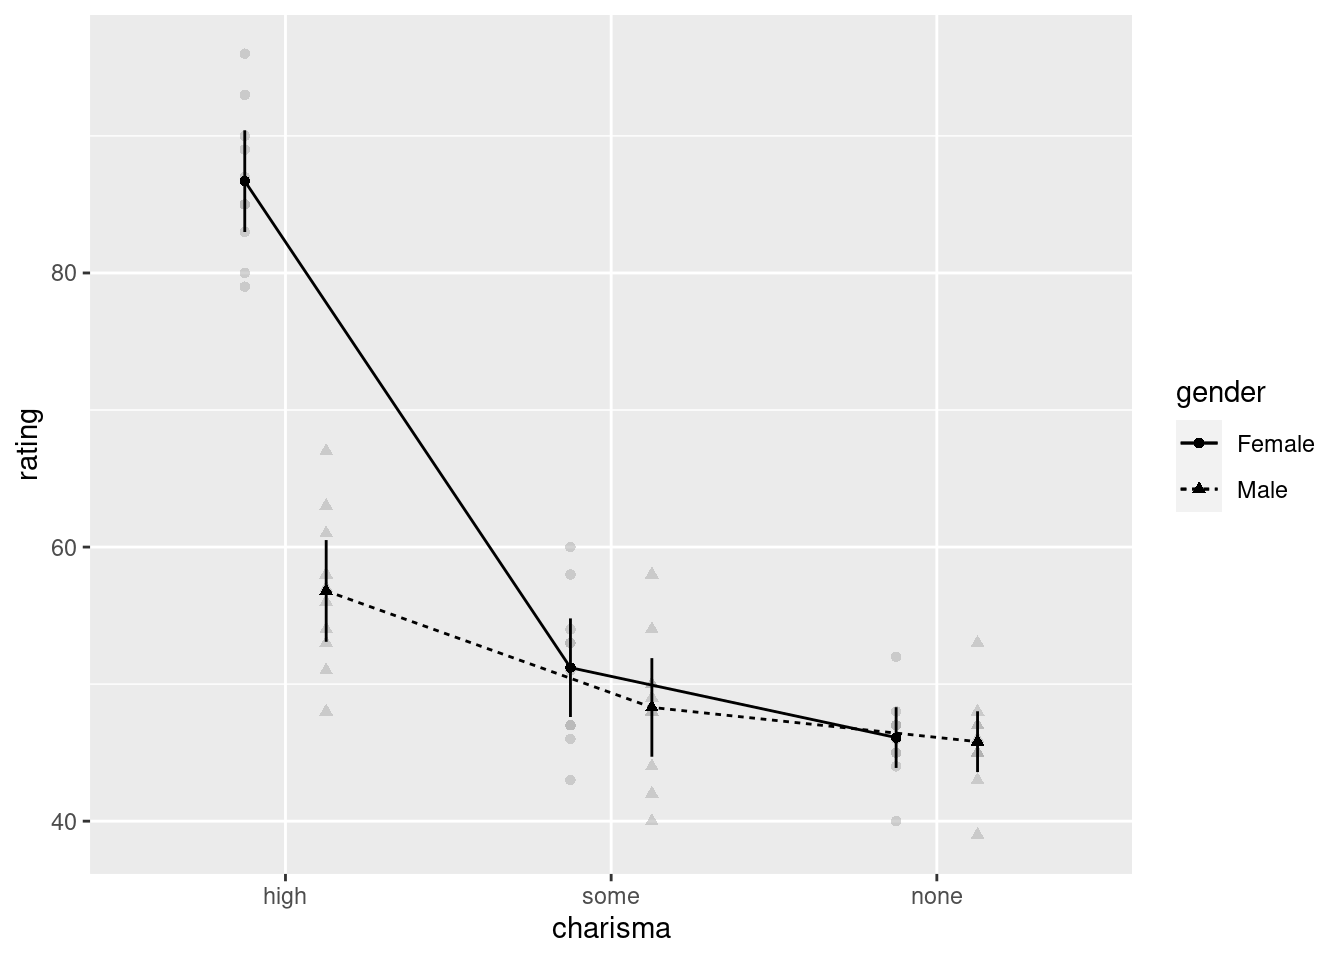
afex_plot(mixed_anova, x ="charisma", trace ="gender")
Warning: Panel(s) show a mixed within-between-design.
Error bars do not allow comparisons across all means.
Suppress error bars with: error = "none"
Sample Result Reporting
(#tab:unnamed-chunk-3) Two-Way ANOVA Statistics for Study Variables
Effect
\(\hat{\eta}^2_G\)
\(F\)
\(\mathit{df}^{\mathrm{GG}}\)
\(\mathit{df}_{\mathrm{res}}^{\mathrm{GG}}\)
\(\mathit{MSE}\)
\(p\)
Gender
.586
71.82
1
18
25.42
< .001
Charisma
.857
167.84
1.89
34.09
24.42
< .001
Gender \(\times\) Charisma
.676
58.10
1.89
34.09
24.42
< .001
A two-way mixed ANOVA was conducted, with gender (female vs. male) as the between-subject independent variable and charisma (high, some, none) as the within-subject independent variable. There was a significant main effect of charisma, \(F(1.89, 34.09) = 167.84\), \(\mathit{MSE} = 24.42\), \(p < .001\), \(\hat{\eta}^2_G = .857\). As shown in the figure, overall female participants provided a higer rating than male participants. There was also a significant main effect of gender, \(F(1, 18) = 71.82\), \(\mathit{MSE} = 25.42\), \(p < .001\), \(\hat{\eta}^2_G = .586\). As shown in the figure, ratings were higher for partners who had high charisma. Finally, there was a significant charisma \(\times\) gender interaction, \(F(1.89, 34.09) = 58.10\), \(\mathit{MSE} = 24.42\), \(p < .001\), \(\hat{\eta}^2_G = .676\). As shown in the figure, while the ratings were similar between female and male participants for partners who had some or no charisma, female participants gave higher ratings for the partner with high charisma, as compared to male participants.
Footnotes
Field, A. P. (2017). Discovering Statistics Using IBM SPSS Statistics (5th ed.). Sage.↩︎