What to Do If Measurement Invariance Does Not Hold?
Let’s Look at the Practical Significance
Hok Chio (Mark) Lai
University of Southern California
September 24, 2021
Overview
Overview
What is measurement invariance?
Overview
What is measurement invariance?
An attempt to synthesize invariance studies on a depression scale across genders (G. Zhang, Yue, & Lai)
Overview
What is measurement invariance?
An attempt to synthesize invariance studies on a depression scale across genders (G. Zhang, Yue, & Lai)
Effect size for noninvariance
Overview
What is measurement invariance?
An attempt to synthesize invariance studies on a depression scale across genders (G. Zhang, Yue, & Lai)
Effect size for noninvariance
Practical invariance at the test score level
Region of measurement equivalence (Y. Zhang, Lai, & Palardy)
Impact on selection/diagnostic/classification accuracy (Lai & Y. Zhang)
- Background
- Graph of measurement invariance
- Numerical representation
- Weighting scale in the moon vs. the earth
- A lot of invariance studies
- Problem: Are invariance results interpretable?
- Problem: How do we make use of invariance results?
- Example: CES-D
- All items were found noninvariant in at least one study
- Studies generally do not reference earlier study on same/similar research questions
- Very little consequences for subsequent practices * Most papers still uses the same CES-D score for regression analyses
- Graph of measurement invariance
- Adjusted estimations and inferences
- Using traditional SEM framework
- Also cite alignment papers
- CONS: A complex model for a simple research question
- CONS: Interpretational confounds/propagation of errors
- Use examples from Levy (2017)
- CONS:
- Using two-step approaches
- Integrative data analysis
- Does not incorporate measurement error in factor scores
- Factor score regression (not yet studied for invariance)
- Integrative data analysis
- Two-Stage Path Analysis
- Step 1: factor score estimation, with reliability information
- CFA, IRT, network quantities, as long as information on reliability is available
- Step 2: path analysis with definition variables
- Reliability adjustment (much earlier in the literature)
- But, individual-specific reliability is allowed, using definition variables
- Can be done in OpenMx and Mplus, and potentially in Bayesian
engines (not sure in
blavaan) - Does require normality assumption on the conditional sampling/posterior
distributions of the factor scores
- May not hold for IRT models in small samples
- Simulation results
- Step 1: factor score estimation, with reliability information
- Using traditional SEM framework
Measurement Invariance
That the same construct is measured in the same way

Measurement Invariance
That the same construct is measured in the same way

Examples
Same distance, same number in different states
- cf. kilometer vs. mile
Blood pressure not systematically higher or lower
- cf. blood pressure machine in grocery vs. in hospital
Psychological Measurement
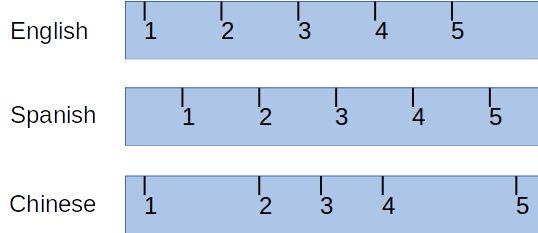
With Measurement Error

Instead of requiring the same score, it requires the same probability distribution
Formal Definition (Mellenbergh, 1989)
- For yj, the score of the jth item, P(yj|η,G=g)=P(yj|η)for all g,η
Formal Definition (Mellenbergh, 1989)
- For yj, the score of the jth item, P(yj|η,G=g)=P(yj|η)for all g,η

Violation of Measurement Invariance (aka Non-Invariance)
E.g.,
- η = true depression level
- y = scores on the Center for Epidemiologic Studies Depression Scale (CES-D)

Invariance Research Is Popular
PsycINFO Keyword (2000 Jan 1 to 2020 Dec 31):
ti("measurement invariance" OR "measurement equivalence" OR "factorial invariance" OR "differential item functioning") OR ab("measurement invariance" OR "measurement equivalence" OR "factorial invariance" OR "differential item functioning")
What Should We Do When Invariance Does Not Hold?
For subsequent analyses
Use latent variable models with partial invariance
Or factor scores (e.g., McNeish & Wolf, 2020; Curran et al., 2009)
- Though most researchers still use composite scores
Can We Still Use the Test in the Future?
Can We Still Use the Test in the Future?
Discard the Test?
Can We Still Use the Test in the Future?
Discard the Test?
Delete noninvariant items?
Can We Still Use the Test in the Future?
Discard the Test?
Delete noninvariant items?
Should it depend on the size of noninvariance?
Can We Still Use the Test in the Future?
Discard the Test?
Delete noninvariant items?
Should it depend on the size of noninvariance?
Does invariance generally hold in psychological measurement?
Can We Still Use the Test in the Future?
Discard the Test?
Delete noninvariant items?
Should it depend on the size of noninvariance?
Does invariance generally hold in psychological measurement?
Or even in physical measurement?
- Could two thermostats of the same model show a systematic difference of 0.01 degree? 0.0001 degree?
Can the Invariance Hypothesis Be True in Practice?
Nil hypothesis (Cohen, 1994)
- H0: ω=0
- I.e., absolutely zero difference in measurement parameters across groups
Can the Invariance Hypothesis Be True in Practice?
Nil hypothesis (Cohen, 1994)
- H0: ω=0
- I.e., absolutely zero difference in measurement parameters across groups
"My work in power analysis led me to realize that the nil hypothesis is always false." (p. 1000)
Case Study
CES-D Across Genders
G. Zhang, Yue, & Lai (2021 IMPS presentation)
- 32 articles conducting invariance tests on CES-D across genders
G. Zhang, Yue, & Lai (2021 IMPS presentation)
- 32 articles conducting invariance tests on CES-D across genders
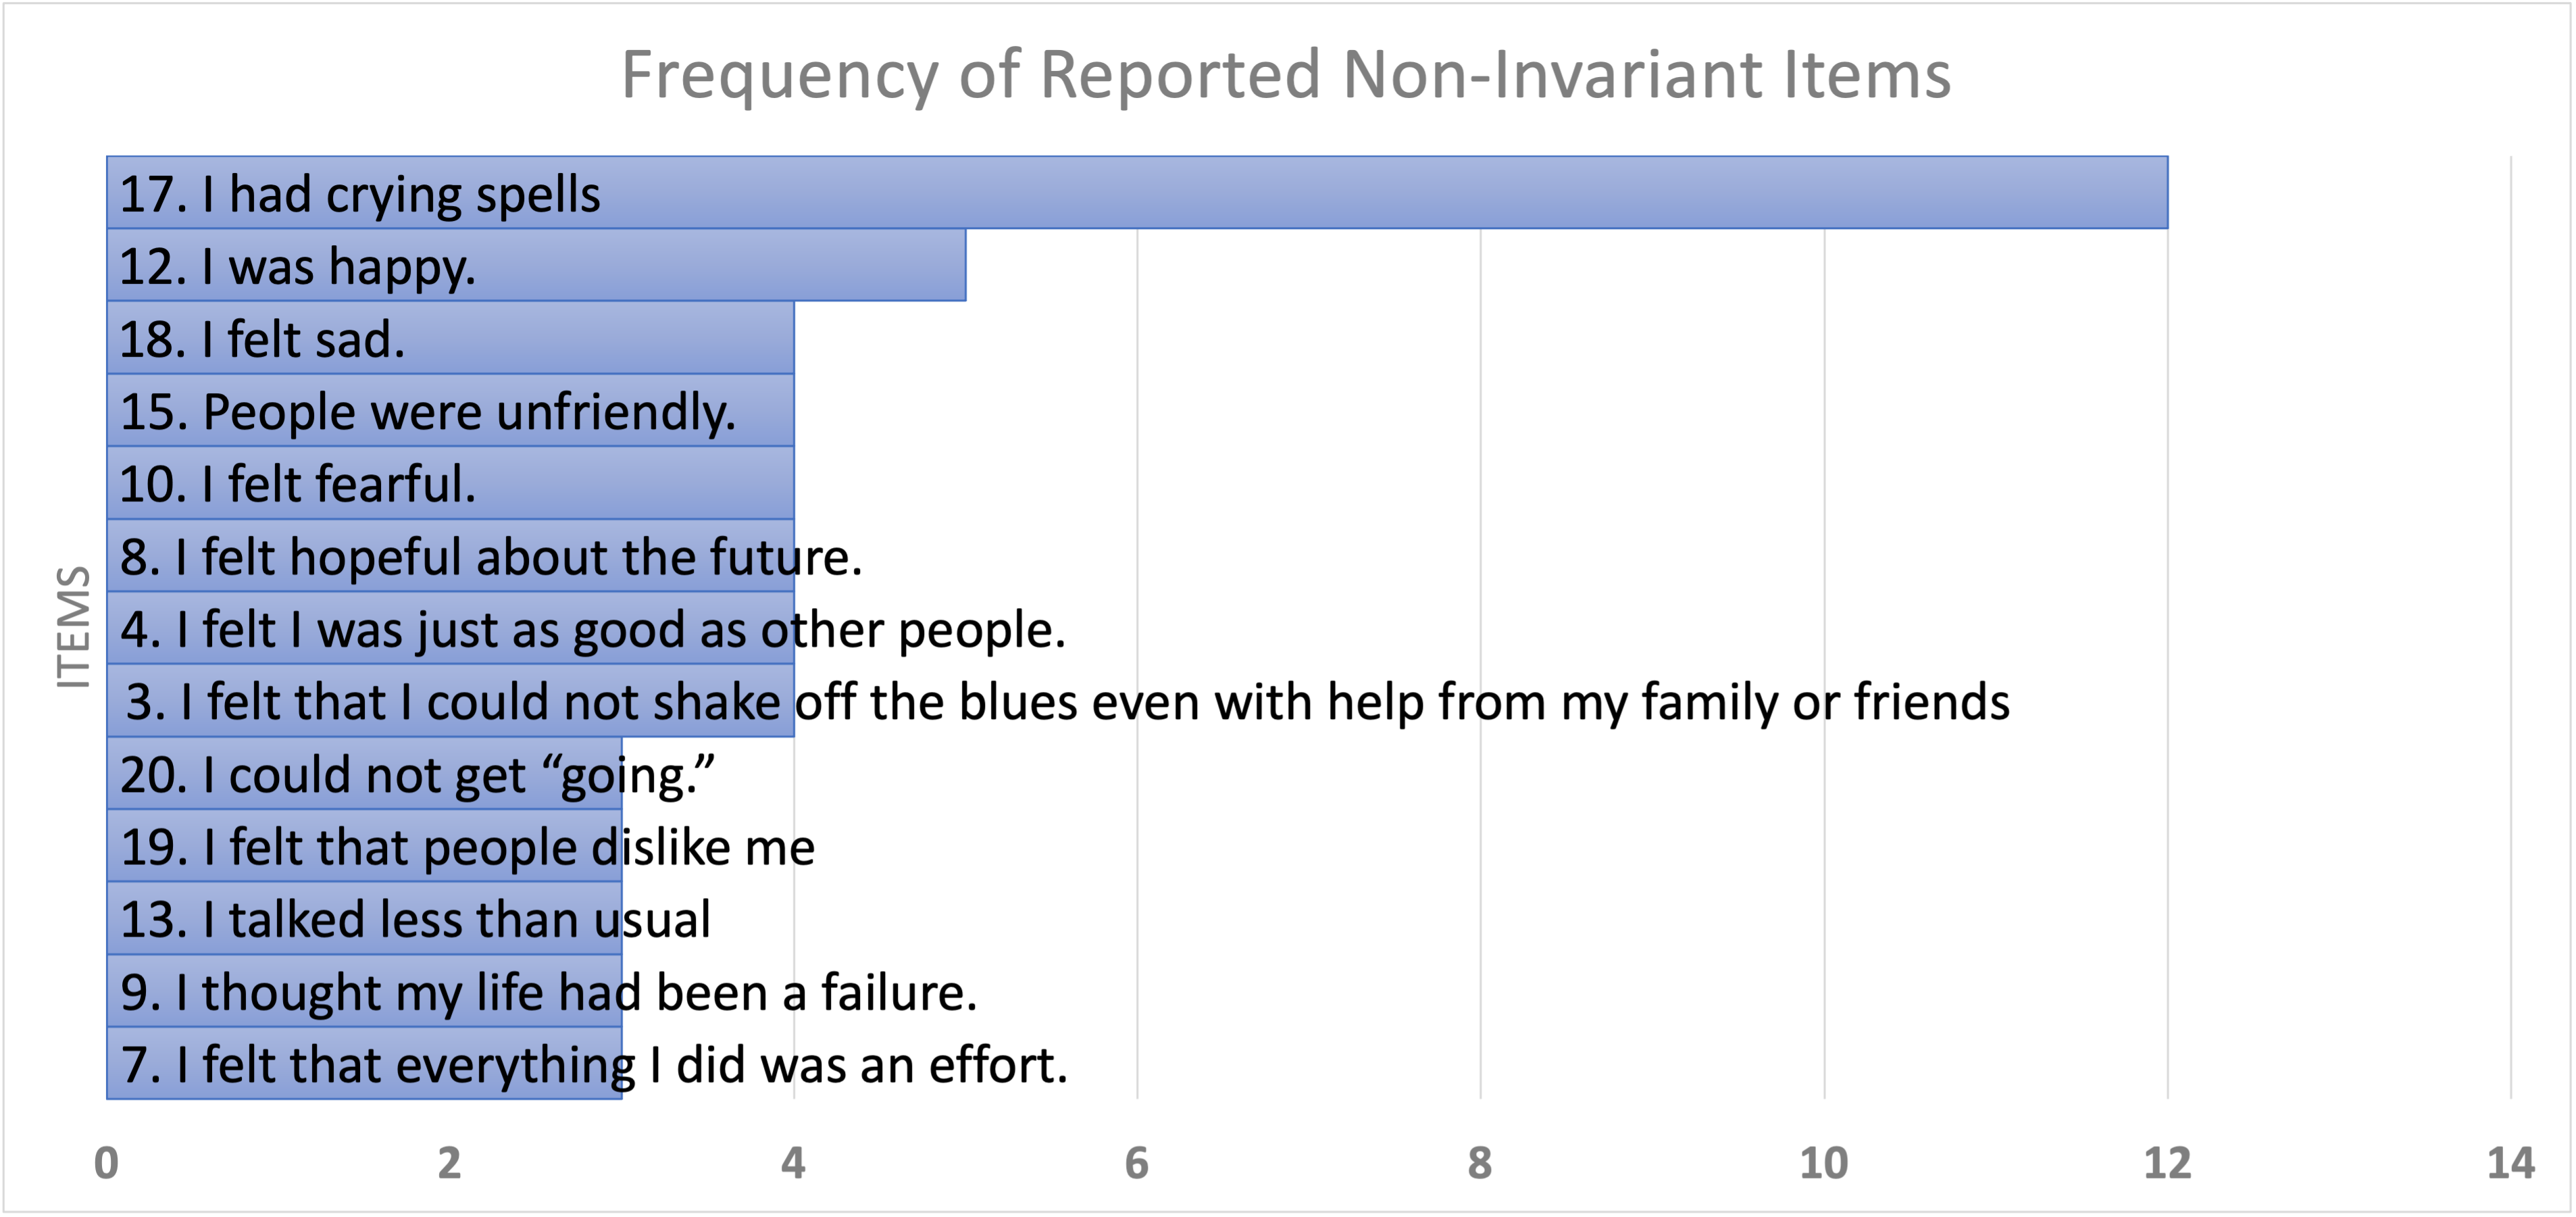
EVERY ONE of the 20 CES-D items was found noninvariant at least once
EVERY ONE of the 20 CES-D items was found noninvariant at least once
Possible reasons
- False positives
EVERY ONE of the 20 CES-D items was found noninvariant at least once
Possible reasons
False positives
Inconsistent methods and cutoffs used to determine invariance
EVERY ONE of the 20 CES-D items was found noninvariant at least once
Possible reasons
False positives
Inconsistent methods and cutoffs used to determine invariance
Gender is confounded with some other sample characteristics that differ across studies
EVERY ONE of the 20 CES-D items was found noninvariant at least once
Possible reasons
False positives
Inconsistent methods and cutoffs used to determine invariance
Gender is confounded with some other sample characteristics that differ across studies
Or, the invariance hypothesis is always rejected when sample size is large
Case Study: CES-D Across Genders
Generally, each study gives binary results on invariance/noninvariance
- Hard to summarize/synthesize the invariance literature
Case Study: CES-D Across Genders
Generally, each study gives binary results on invariance/noninvariance
Hard to summarize/synthesize the invariance literature
Practical implications?
- Dropping the "crying spell" item?
- Different cutoffs for screening?
Like repeating the history in early studies when each study is either significant/non-significant
Effect Size
- Meade (2010) "A taxonomy of effect size measures"
- Nye & Drasgow (2011): more comparable to the popular Cohen's d
dMACSj =1SDjp√∫E(YjR−YjF|η)2fF(η)dη (F = focal group, R = reference group)
- Extensions in Nye et al. (2019) and Gunn et al. (2020) on signed differences

How much does the noninvariance lead to group differences in the item scores in standardized unit
Effect Sizes in the CES-D Invariance Synthesis
Only 31% provided sufficient information to compute dMACS
- For ones that can be computed, dMACSfemale - male = -.20 to .97
Effect Sizes in the CES-D Invariance Synthesis
Only 31% provided sufficient information to compute dMACS
- For ones that can be computed, dMACSfemale - male = -.20 to .97
Information commonly missing: loadings, intercepts, item SDs
Summary
Invariance results are highly inconsistent across studies (at least for binary conclusions)
Little synthesis across invariance studies
Implication for future use of the test is unclear
Summary
Invariance results are highly inconsistent across studies (at least for binary conclusions)
Little synthesis across invariance studies
Implication for future use of the test is unclear
Recommendations
Compute effect sizes in invariance studies
- Need software implementation
Report group-specific parameters, or sufficient statistics (e.g., means and covariance matrix)

(Practical) Invariance at the Test Score Level
Why Test Scores?
Usually, test scores, not item scores, are used for
Why Test Scores?
Usually, test scores, not item scores, are used for
- Operationalization of constructs in research
Why Test Scores?
Usually, test scores, not item scores, are used for
Operationalization of constructs in research
Comparing individuals on psychological constructs
Why Test Scores?
Usually, test scores, not item scores, are used for
Operationalization of constructs in research
Comparing individuals on psychological constructs
Making selection/diagnostic/classification decisions
Why Test Scores?
Usually, test scores, not item scores, are used for
Operationalization of constructs in research
Comparing individuals on psychological constructs
Making selection/diagnostic/classification decisions
Noninvariance in items may cancel out
Why Test Scores?
Usually, test scores, not item scores, are used for
Operationalization of constructs in research
Comparing individuals on psychological constructs
Making selection/diagnostic/classification decisions
Noninvariance in items may cancel out
Test invariance/lack of differential test functioning
P(T|η,G=g)=P(T|η)for all g,η
Y. Zhang, Lai, & Palardy (Under Review)
When can we say a test is practically invariant with respect to G?
Y. Zhang, Lai, & Palardy (Under Review)
When can we say a test is practically invariant with respect to G?
A Bayesian region of measurement equivalence (ROME) approach
Example
Educational Longitudinal Study (ELS: 2002; U.S. Department of Education, 2004)
- N = 11,663 10th grade students (47.69% male, 52.31% female)
Example
Educational Longitudinal Study (ELS: 2002; U.S. Department of Education, 2004)
- N = 11,663 10th grade students (47.69% male, 52.31% female)
5-Item Math-Specific Self-Efficacy
(1 = Almost Never to 4 = Almost Always)
- I'm certain I can understand the most difficult material presented in my math texts.
- I'm confident I can understand the most complex material presented by my math teacher.
- I'm confident I can do an excellent job on my math assignments.
- I'm confident I can do an excellent job on my math tests.
- I'm certain I can master the skills being taught in my math class.
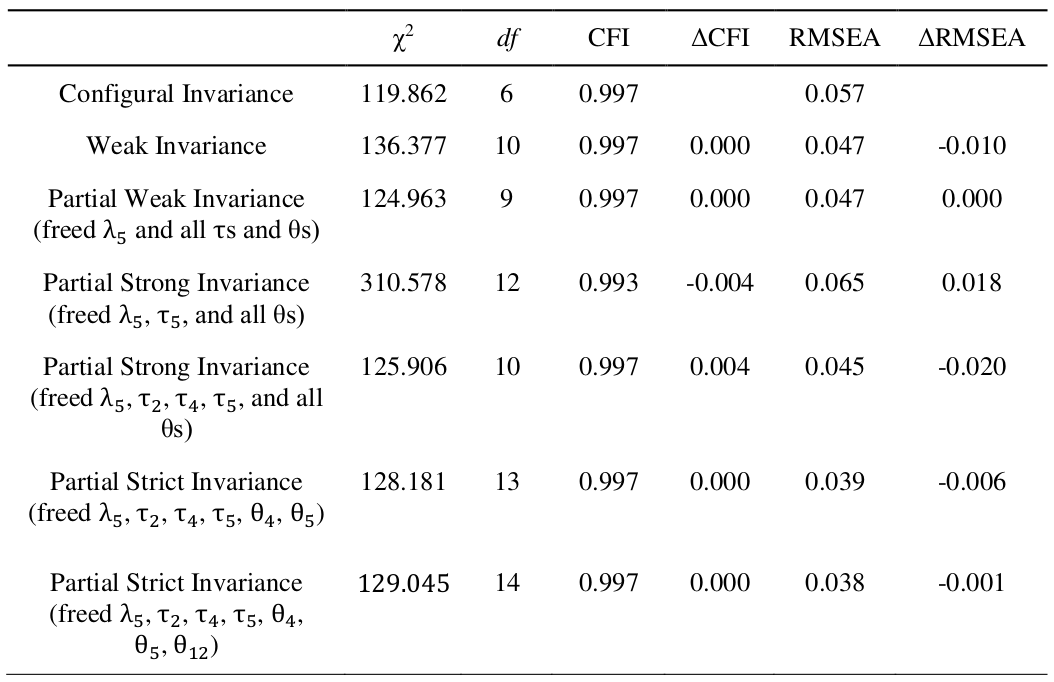

dMACS = 0.097 to 0.11 for items 2, 4, 5
Test level: d=1SDTp√∫E(TR−TF|η)2fF(η)dη=.026
Limitation: overall ES may be small, but the test may not be suitable for specific population
Can We Conclude the Scale is Practically Invariant?
Can We Conclude the Scale is Practically Invariant?
Null hypothesis significance testing does not allow accepting the null hypothesis (e.g., Yuan & Chan, 2016)
- H0: Δω=0
- ω: measurement parameters
Can We Conclude the Scale is Practically Invariant?
Null hypothesis significance testing does not allow accepting the null hypothesis (e.g., Yuan & Chan, 2016)
- H0: Δω=0
- ω: measurement parameters
- Equivalence testing by Yuan & Chan (2016)
- Rely on a fit index (e.g., RMSEA) metric
Region of Practical Equivalence (ROPE)
Accept δ=0 practically if P(δ∈ROPE) is high
- δ: some measure of difference between groups
Region of Practical Equivalence (ROPE)
Accept δ=0 practically if P(δ∈ROPE) is high
δ: some measure of difference between groups
ROPE (Berger & Hsu, 1996; Kruschke, 2011):
values inside [δ0L,δ0U] considered practically equivalent to null
Reject H0: |δ|≥ϵ for some small ϵ when
- highest posterior density interval (HPDI) is completely within ROPE
E.g., pharmaceutical industry, whether two drugs are equivalent to make the drug generic; bioequivalence
Region of Practical Equivalence (ROPE)
Accept δ=0 practically if P(δ∈ROPE) is high
δ: some measure of difference between groups
ROPE (Berger & Hsu, 1996; Kruschke, 2011):
- values inside [δ0L,δ0U] considered practically equivalent to null
- Reject H0: |δ|≥ϵ for some small ϵ when
- highest posterior density interval (HPDI) is completely within ROPE

Our Proposal: Region of Measurement Equivalence (ROME)
- δ=E(T2−T1|η)=(∑jΔνj)+(∑jΔλj)η
Our Proposal: Region of Measurement Equivalence (ROME)
δ=E(T2−T1|η)=(∑jΔνj)+(∑jΔλj)η
Determining ROME
- Requires substantive judgment
- Kruschke (2011) recommended half of small effect size: [−0.1sTp,0.1sTp]
Our Proposal: Region of Measurement Equivalence (ROME)
δ=E(T2−T1|η)=(∑jΔνj)+(∑jΔλj)η
Determining ROME
- Requires substantive judgment
- Kruschke (2011) recommended half of small effect size: [−0.1sTp,0.1sTp]
- Options we considered
- 2.5% of total test score range (5 to 20)
- or [−0.375,0.375]
- 0.1 × pooled SD of total score
- or [−0.412,0.412]
- 2.5% of total test score range (5 to 20)
Using ROME
Practically invariant if HPDI of E(T2−T1|η) is within ROME for all practical levels of η
If not, can identify whether the test is practically invariant for some levels of η
Test Characteristic Curve
Estimation with blavaan (Merkle et al.)
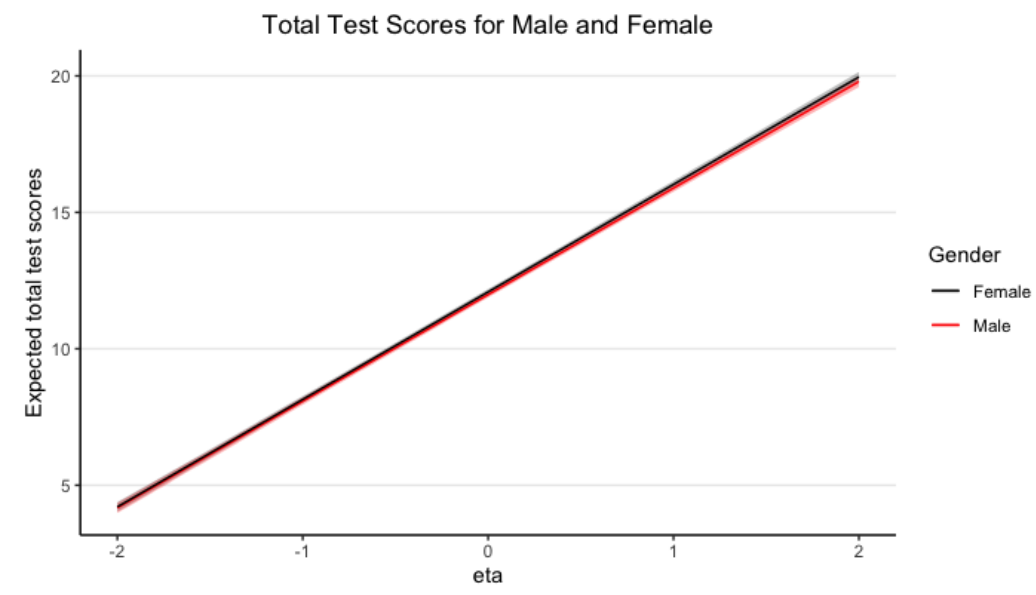
Expected Group Differences (Female - Male)
Black horizontal lines indicate ROME
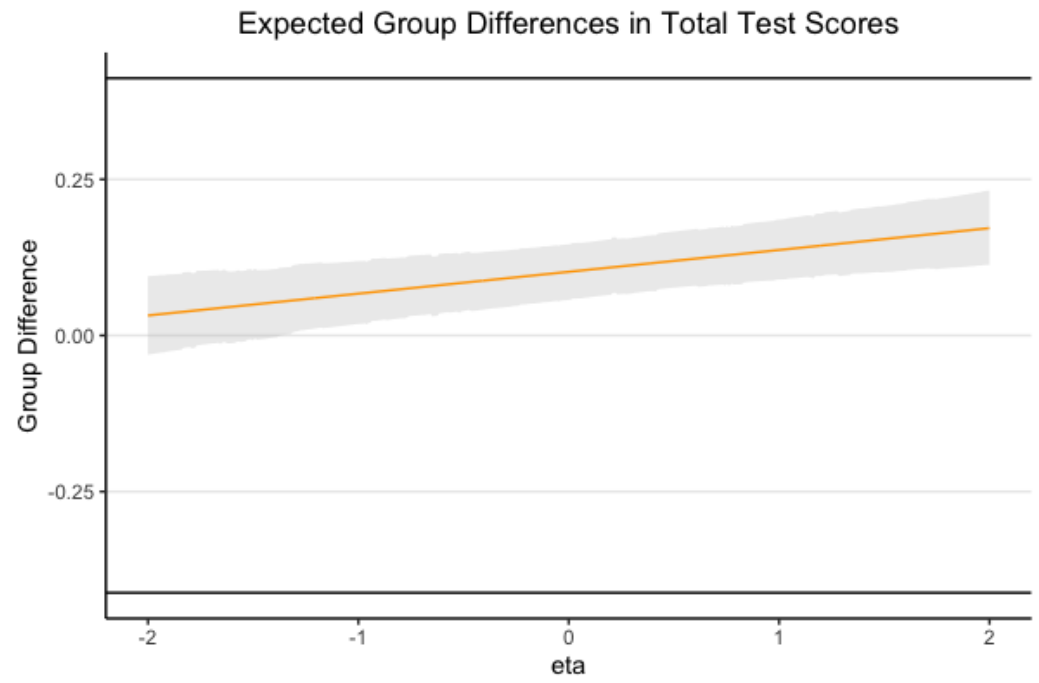
Ordinal Factor Analysis
Estimation with Mplus (ESTIMATOR=BAYES)
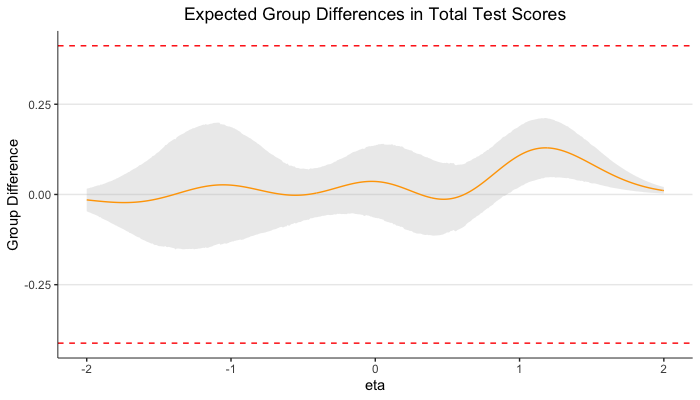
Selection/Diagnostic/Classification Accuracy
How Does Noninvariance Impact Selection Accuracy?
Tests are commonly used to make binary decisions
How Does Noninvariance Impact Selection Accuracy?
Tests are commonly used to make binary decisions
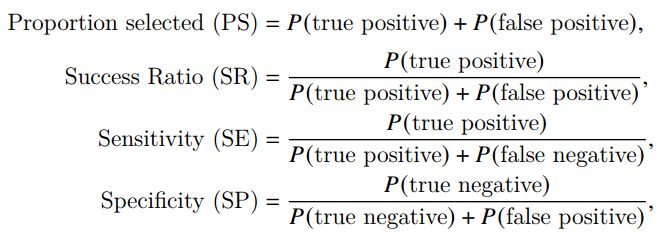
Adverse Impact (AI) ratio=ER(PSF)PSR,

SR is also called positive predictive value
Classification Accuracy Indices
Millsap & Kwok (2004); Stark et al. (2004)
- Does noninvariance affect classification accuracy?
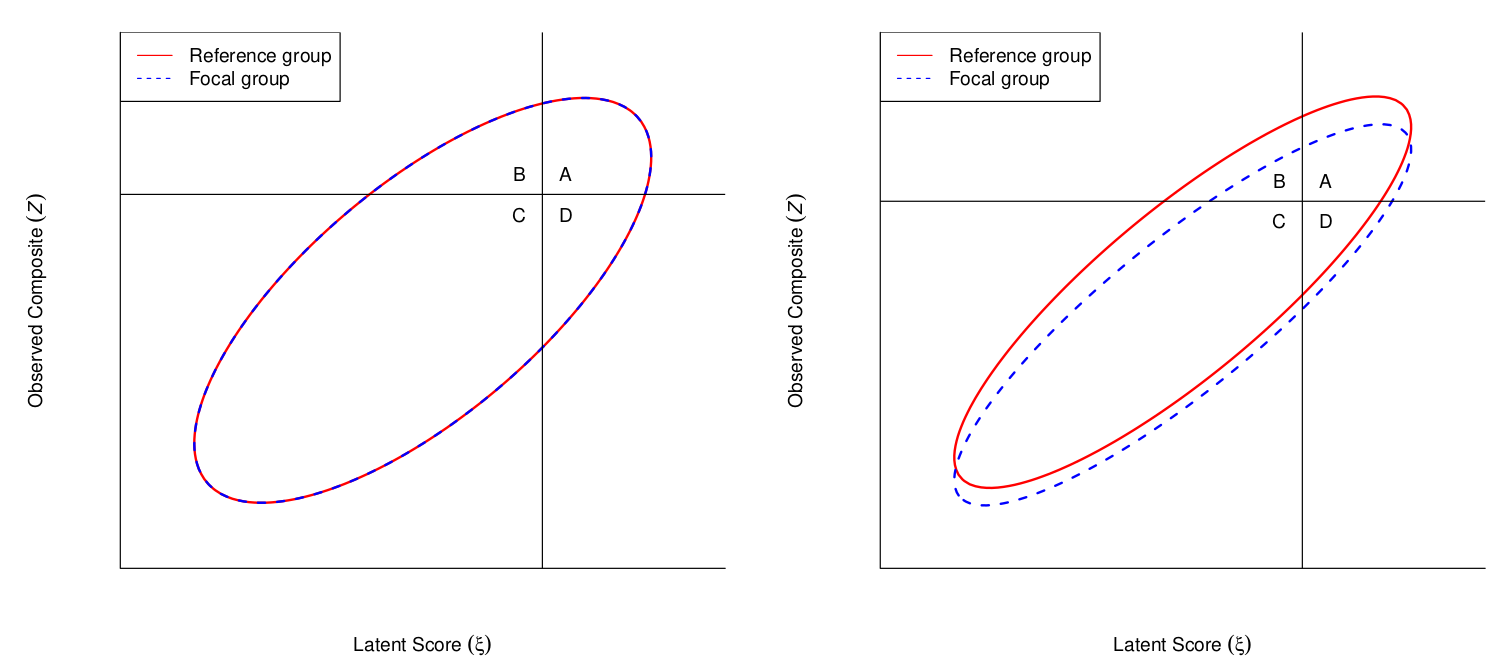
Lai & Y. Zhang (accepted)
Multidimensional Classification Accuracy Analysis (MCAA)
When selection based on multiple subtests
Lai & Y. Zhang (accepted)
Multidimensional Classification Accuracy Analysis (MCAA)
When selection based on multiple subtests
E.g., 20-item mini-IPIP (International Personality Item Pool)
Agreeableness, Conscientiousness, Extraversion, Neuroticism, Openness to Experience
- Sample (Ock et al., 2020)
- N = 564 (239 males, 325 females; 97.7% Caucasian)
- Four items with noninvariant intercepts, three items with noninvariant uniqueness

Latent composite: ζ=wη
Observed composite: Z=cy
(Zgζg)=N([cνg+cΛgαgwαg],[cΛgΨgΛ′gc′+cΘgc′cΛgΨgw′wΨgw′])
Selection weights based on previous studies on criterion validity of the mini-IPIP
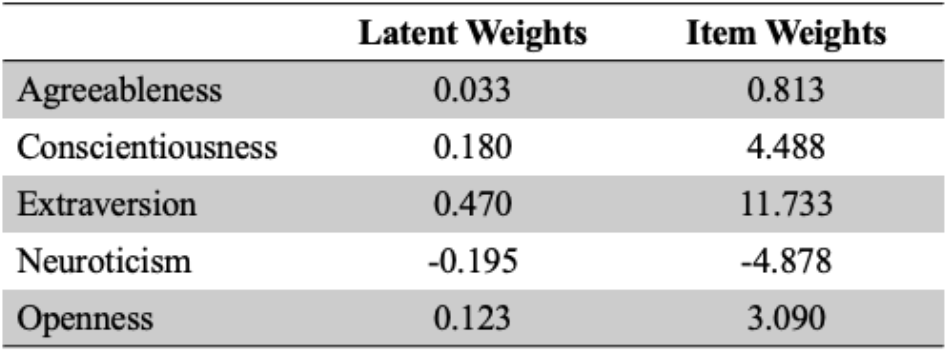
When using the mini-IPIP to select the top 10% of candidates . . .
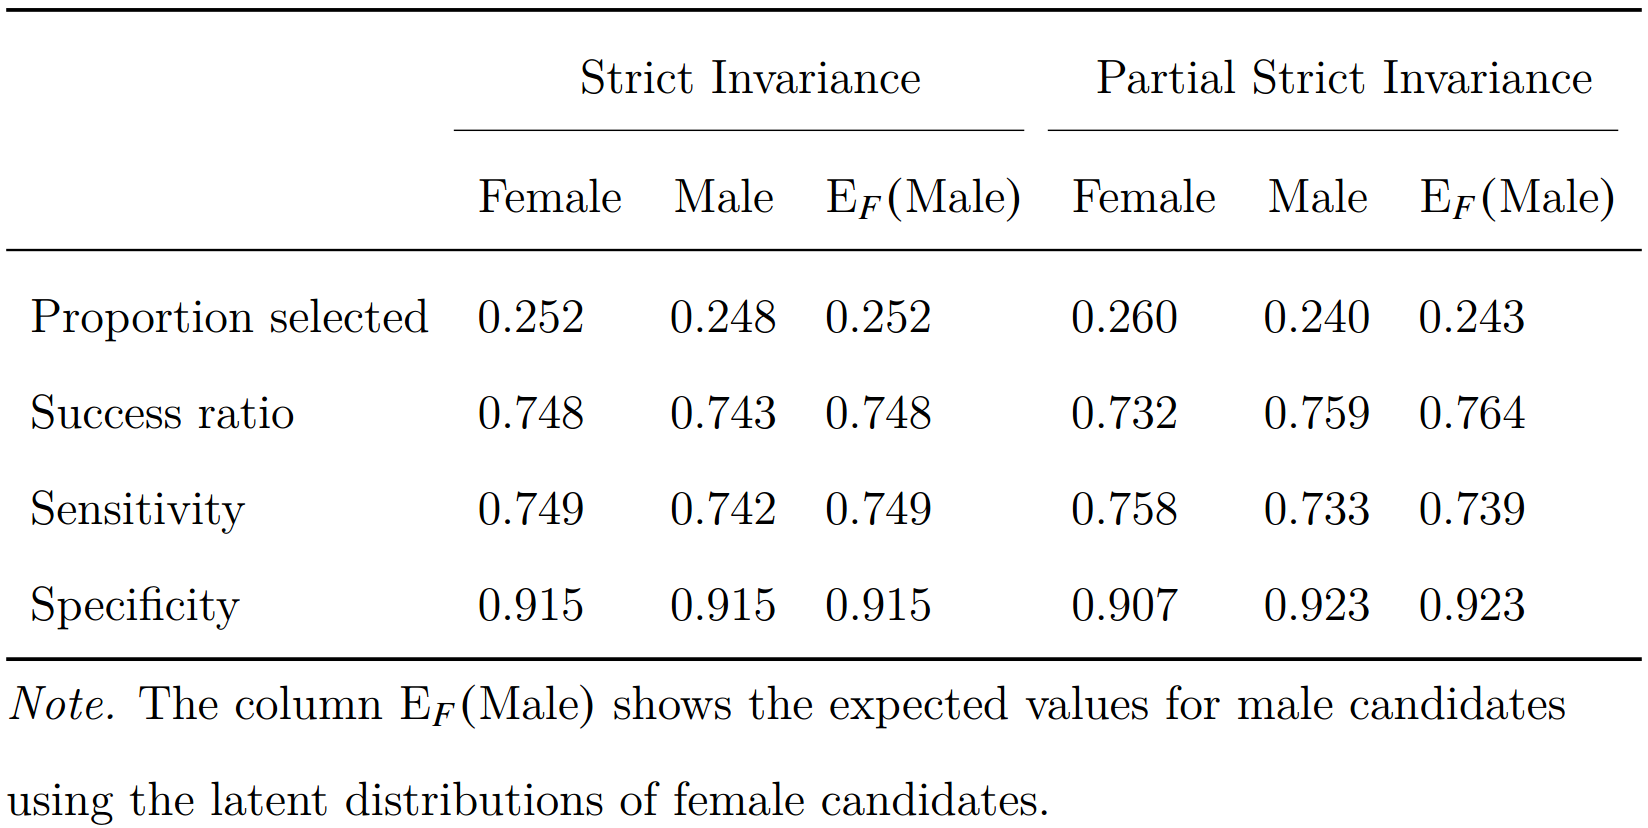
AI ratio = 0.93: slight disadvantage for males due to noninvariance
Summary
Summary
Despite tremendous growth in invariance research, the practical implications of empirical studies are unclear
Summary
Despite tremendous growth in invariance research, the practical implications of empirical studies are unclear
In my opinions, reporting measures of practical significance is a step forward for understanding how noninvariance
Summary
Despite tremendous growth in invariance research, the practical implications of empirical studies are unclear
In my opinions, reporting measures of practical significance is a step forward for understanding how noninvariance
- affects item/test scores
- affects classification accuracy, prevalence, selection ratio, etc
Measures of practical significance can be used to set thresholds for practical invariance
- Region of measurement equivalence (ROME)
More research efforts needed to translate and synthesize invariance research
Future Research
Synthesizing effect sizes from invariance research
- Need sampling variability of dMACS
Future Research
Synthesizing effect sizes from invariance research
- Need sampling variability of dMACS
ROME with alignment/Bayesian approximate invariance
- Bypass the need to find a partial invariance model
Future Research
Synthesizing effect sizes from invariance research
- Need sampling variability of dMACS
ROME with alignment/Bayesian approximate invariance
- Bypass the need to find a partial invariance model
- Uncertainty bounds for classification accuracy
References
Berger, R. L., & Hsu, J. C. (1996). Bioequivalence trials, intersection-union tests and equivalence confidence sets. Statistical Science, 11(4), 283–319. https://doi.org/10.1214/ss/1032280304
Cohen, J. (1994). The earth is round (p < .05). American Psychologist, 49(12), 997–1003. https://doi.org/10.1037/0003-066X.49.12.997
Curran, P. J., & Hussong, A. M. (2009). Integrative data analysis: The simultaneous analysis of multiple data sets. Psychological Methods, 14(2), 81–100. https://doi.org/10.1037/a0015914
Gunn, H. J., Grimm, K. J., & Edwards, M. C. (2020). Evaluation of six effect size measures of measurement non-Invariance for continuous outcomes. Structural Equation Modeling: A Multidisciplinary Journal, 27(4), 503–514. https://doi.org/10.1080/10705511.2019.1689507
Kruschke, J. (2011). Bayesian assessment of null values via parameter estimation and model comparison. Perspectives on Psychological Science, 6(3), 299–312. https://doi.org/10.1177/1745691611406925
McNeish, D., Wolf, M.G. Thinking twice about sum scores. Behav Res 52, 2287–2305 (2020). https://doi.org/10.3758/s13428-020-01398-0
References (cont'd)
Meade, A. (2010). A taxonomy of effect size measures for the differential functioning of items and scales. Journal of Applied Psychology, 95(4), 728–743. https://doi.org/10.1037/a0018966
Mellenbergh, G. J. (1989). Item bias and item response theory. International Journal of Educational Research, 13(2), 127–143. https://doi.org/10.1016/0883-0355(89)90002-5
Millsap, R. E., & Kwok, O.-M. (2004). Evaluating the impact of partial factorial invariance on selection in two populations. Psychological Methods, 9(1), 93–115. https://doi.org/10.1037/1082-989X.9.1.93
Nye, C. D., Bradburn, J., Olenick, J., Bialko, C., & Drasgow, F. (2019). How big are my effects? Examining the magnitude of effect sizes in studies of measurement equivalence. Organizational Research Methods, 22(3), 678–709. https://doi.org/10.1177/1094428118761122
Nye, C. D., & Drasgow, F. (2011). Effect size indices for analyses of measurement equivalence: Understanding the practical importance of differences between groups. Journal of Applied Psychology, 96(5), 966–980. https://doi.org/10.1037/a0022955
References (cont'd)
Stark, S., Chernyshenko, O. S., & Drasgow, F. (2004). Examining the effects of differential item (functioning and differential) test functioning on selection decisions: When are statistically significant effects practically important? Journal of Applied Psychology, 89(3), 497–508. https://doi.org/10.1037/0021-9010.89.3.497
U.S. Department of Education, National Center for Education Statistics. (2004). Education longitudinal study of 2002: Base year data file user’s manual, by Steven J. Ingels, Daniel J. Pratt, James E. Rogers, Peter H. Siegel, and Ellen S. Stutts. Washington, DC.
Yuan, K. H., & Chan, W. (2016). Measurement invariance via multigroup SEM: Issues and solutions with chi-square-difference tests. Psychological Methods, 21(3),405–426. https://doi.org/10.1037/met0000080
Thanks!
Questions?
My email: hokchiol@usc.edu
Slides created via the R package xaringan.
The chakra comes from remark.js, knitr, and R Markdown.
