Multilevel Bootstrap Confidence Intervals for Standardized Effect Size
Hok Chio (Mark) Lai
University of Southern California
2020/07/14
1 / 21
Overview
Multilevel Bootstrap
The "bootmlm" package
Effect size for cluster-randomized trials
Simulation Results
Lai, M. H. C. (2020). Bootstrap confidence interval for multilevel standardized effect size. Multivariate Behavioral Research. https://doi.org/10.1080/00273171.2020.1746902
2 / 21
Multilevel Bootstrap Confidence Interval (CI)
Good alternatives to analytic CIs
- for quantities with nonnormal sampling distributions
- when analytic CIs are hard to obtain
- when some model assumptions are violated
3 / 21
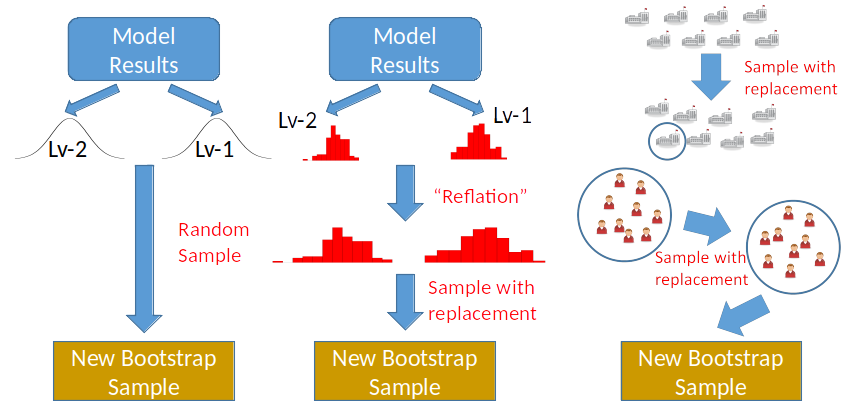
Parameteric, Residual, and Case Bootstrap

4 / 21
- Parametric: no normal sampling distribution assumption
- Residual: no multivariate normality assumption on error terms
- Case: no parametric assumptions
Types of Bootstrap CIs
Received less attention in the multilevel literature
- Normal: [^θ±2√v∗]
- Basic/percentile-t: [2^θ−^θ∗1−α/2,2^θ−^θ∗α/2]
- Studentized/Bootstrap-t: (^θ−θ)/√v as pivot
- Percentile: [^θ∗α/2,^θ∗1−α/2]
- Bias-corrected and accelerated (BCa): correct for bias and skewness (acceleration)
5 / 21
R Package bootmlm
6 / 21
bootmlm
https://github.com/marklhc/bootmlm
- Implement various bootstrapping schemes and bootstrap CIs
- Additional experimental functionality
- e.g., weighted bootstrap based on sampling weights (Wen & Lai, under reviewer)
- Currently only supports
lme4::lmer()in R
7 / 21
Example
fm01ML <- lmer(Yield ~ (1 | Batch), Dyestuff, REML = FALSE)mySumm <- function(x) { # Function to extract fixed effects and level-1 error SD c(getME(x, "beta"), sigma(x))}# Covariance preserving residual bootstrapboo01 <- bootstrap_mer(fm01ML, mySumm, type = "residual", nsim = 100)# Get confidence intervalboot.ci(boo01, index = 2, type = c("norm", "basic", "perc"))# BCa using influence values computed from `empinf_mer`boot.ci(boo01, index = 2, type = "bca", L = empinf_mer(fm01ML, mySumm, 2))8 / 21
Multilevel Effect Size
9 / 21
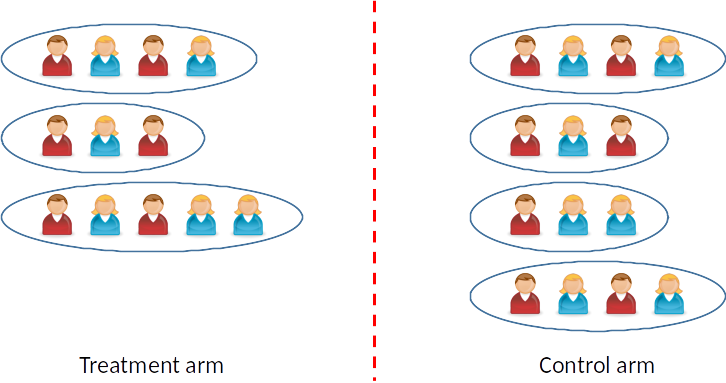
Cluster-Randomized Trials (CRTs)

10 / 21
Image credit: Wikimedia Commons
Motivating Example
Haug et al. (2017)
- Outcome: Estimated peak blood alcohol concentration (BAC)
Intervention
- Web- and text messaging-based intervention
- NT=547 students from JT=43 schools
Control
- Assessment only
- NC=494 students from JT=37 schools
11 / 21
Multilevel Effect Size
- Estimated treatment effect (from simulated data) = -0.09, SE = 0.09
- Need to interpret the magnitude of the effect
Extension of Cohen's d/Hedges's g
- Hedges (2007, p. 348), using summary statistics d=¯YT..−¯YC..^σTotal
- Hedges (2009, 18.24), using linear-mixed-effect model estimates ^δ=^γ√^σ2W+^σ2B
12 / 21
Analytic Approximate CIs Available, But
- Sampling distribution of effect size is generally not normal
- Random effects/error terms may be non-normal
- For BAC, skewness ~ 2, kurtosis ~ 4.8
- Not scalable to more complex designs
- Hedges (2011) for 3-level; Lai & Kwok (2014) for cross-classified; Lai & Kwok (2016) for partially nested designs
13 / 21
Using bootmlm
d d_boot normal.ll normal.ul basic.ll basic.ul -0.092 -0.092 -0.278 0.095 -0.274 0.097student.ll student.ul percent.ll percent.ul bca.ll bca.ul -0.281 0.097 -0.281 0.089 -0.263 0.119Compared to
Ignoring the clustered structure: d = -0.92, 95% CI [-0.207, 0.036]
- CI width about 35% too short
14 / 21
Monte Carlo Simulation Study
15 / 21
Design Conditions
| Factor | Levels |
|---|---|
| ICC | .05, .10, .20 |
| Level-2 skew | Normal, skewed |
| Level-1 skew | Normal, skewed |
| # Clusters (J) | 20, 30, 70 |
| Average cluster size (n) | 5, 25 |
| Imbalance | Balance, imbalance |
| Population Effect Size | 0, 0.5 |
Data Generating Model
yij=γ00+γ01TREATj+u0j
Case bootstrap did not perform well, consistent with previous literature
16 / 21
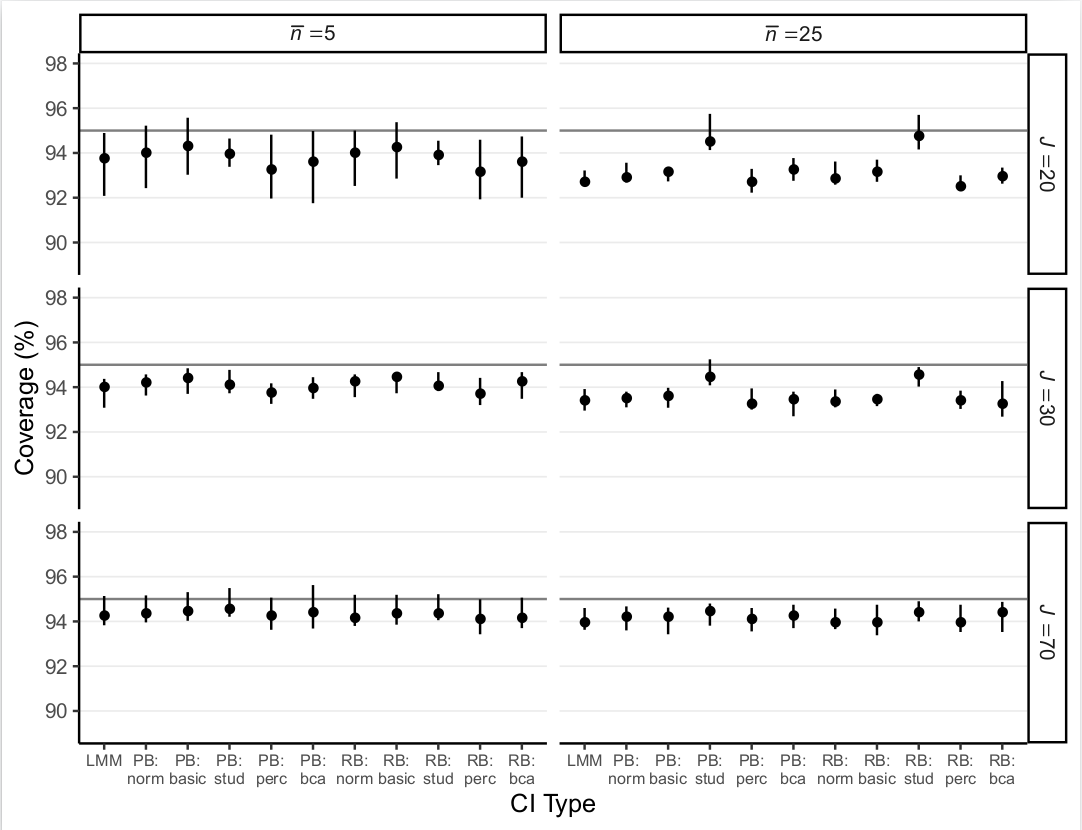
Normal Data

17 / 21
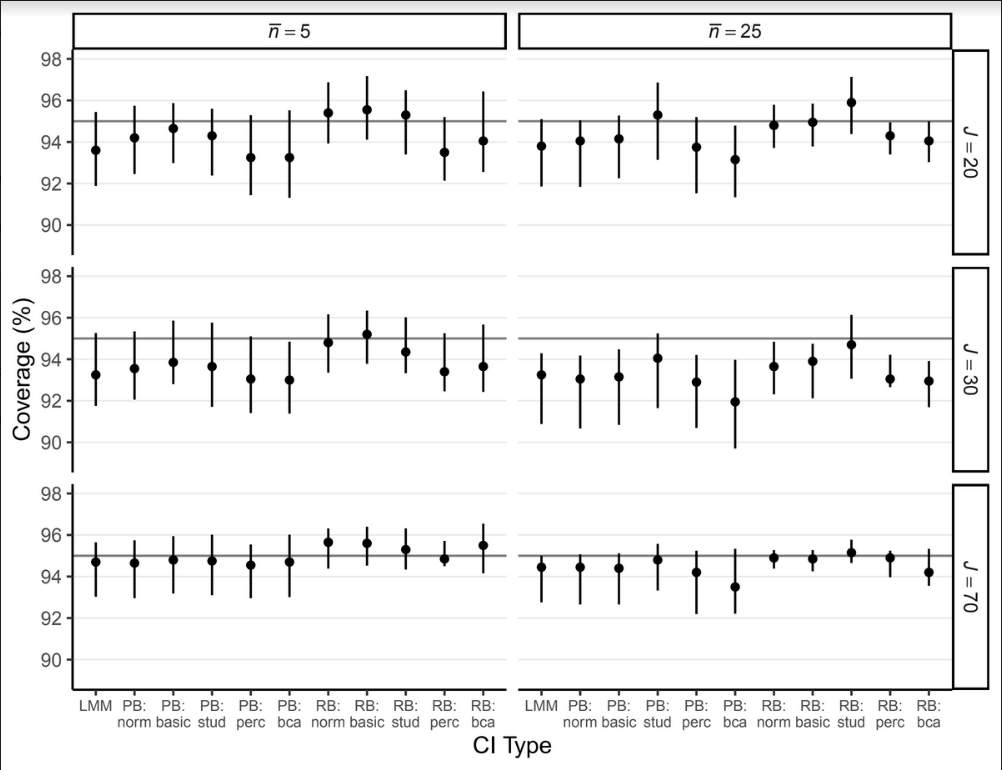
Skewed at Both Levels

18 / 21
Summary of Results

- Residual bootstrap with studentized CI performed best overall
- Residual bootstrap with basic CI performed best in small samples
- Effect of nonnormality is modest on coverage rates
19 / 21
Conclusions
- Bootstrap CIs can be obtained when analytic CIs are hard to obtain
- Residual bootstrap with studentized/basic CIs are promising for effect size
Future work is needed
- Other designs (crossed, covariate-adjusted, etc)
- Other quantities (e.g., R2, indirect effects)
20 / 21
Thanks!
For questions, email me at hokchiol@usc.edu
For full results, see the full paper
Slides created via the R package xaringan.
21 / 21