class: center, middle, inverse, title-slide # Multilevel Modeling (MLM) ## An Introduction <html> <div style="float:left"> </div> <hr color='#EB811B' size=1px width=796px> </html> ### Mark Lai ### 2018/11/27 --- # Different Names Hierarchical linear model .font60[(HLM; Raudenbush and Bryk, 2002)] Mixed/Mixed-effects model .font60[(Littell, Milliken, Stroup, et al., 1996)] Random coefficient model .font60[(de Leeuw and Kreft, 1986)] Variance component model .font60[(Aitkin and Longford, 1986)] ??? Ask them to introduce themselves and what research they are interested in Like a lot of terminologies in statistics --- # Roadmap What are multilevel data? Why use MLM? - Avoid underestimated _SE_ - Research questions at different levels - Cluster-specific (or person-specific) regression lines --- # Multilevel Data Nested Data - Students in classrooms/schools - Siblings in families - Clients in therapy groups/therapists/clinics - Employees in organizations in countries  ??? What other examples can you think about? --- # Multilevel Data - Repeated measures in individuals .center[  ] ### Network Graph <div id="htmlwidget-785d1f0c43f77d7abfaa" style="width:90%;height:20%;" class="grViz html-widget"></div> <script type="application/json" data-for="htmlwidget-785d1f0c43f77d7abfaa">{"x":{"diagram":"\ndigraph boxes_and_circles {\n graph [overlap = true, fontsize = 24]\n\n node [penwidth = 0]\n # Schools\n A; B; C; D\n # Students\n 1; 2; 3; 4; 5; 6; 7; 8; 9; 10; 11\n\n # edges\n edge [dir = \"none\"]\n A -> {1; 2; 3}\n B -> {4; 5}\n C -> {6; 7; 8; 9}\n D -> {10; 11}\n}\n","config":{"engine":"dot","options":null}},"evals":[],"jsHooks":[]}</script> ??? Nesting: multiple units belongs to the same higher-level unit Level-1: lowest level; Level-2: the next level --- # Applications of MLM Psychotherapy - Heterogeneity of treatment effectiveness across therapists Educational research - teacher expectations on students' performance Organizational research - Job strain and ambulatory blood pressure --- # Applications of MLM (cont'd) Cross-national/neighborhood research - Sociopolitical influence on psychological processes (e.g., age and generalized trust) - Post-materialism, locus of control, and concern for global warming Longitudinal analysis/repeated measures - Aging, self-esteem, and stress appraisal --- # Example Data Sample simulated data on students' popularity from Hox, Moerbeek, & van de Schoot (2018) - 2000 pupils (level 1) in 100 classrooms (level 2) .font60[ <table> <thead> <tr> <th style="text-align:left;"> Variable </th> <th style="text-align:left;"> Description </th> </tr> </thead> <tbody> <tr> <td style="text-align:left;"> pupil </td> <td style="text-align:left;"> pupil ident </td> </tr> <tr> <td style="text-align:left;"> class </td> <td style="text-align:left;"> class ident </td> </tr> <tr> <td style="text-align:left;"> extrav </td> <td style="text-align:left;"> extraversion </td> </tr> <tr> <td style="text-align:left;"> sex </td> <td style="text-align:left;"> pupil sex </td> </tr> <tr> <td style="text-align:left;"> texp </td> <td style="text-align:left;"> teacher experience in years </td> </tr> <tr> <td style="text-align:left;"> popular </td> <td style="text-align:left;"> popularity sociometric score </td> </tr> <tr> <td style="text-align:left;"> popteach </td> <td style="text-align:left;"> popularity teacher evaluation </td> </tr> </tbody> </table> ] --- class: clear .font60[ <div id="htmlwidget-0cb15ce2c6234b20978f" style="width:100%;height:auto;" class="datatables html-widget"></div> <script type="application/json" data-for="htmlwidget-0cb15ce2c6234b20978f">{"x":{"filter":"none","data":[["1","2","3","4","5","6","7","8","9","10","11","12","13","14","15","16","17","18","19","20","21","22","23","24","25","26","27","28","29","30","31","32","33","34","35","36","37","38","39","40","41","42","43","44","45","46","47","48","49","50","51","52","53","54","55","56","57","58","59","60","61","62","63","64","65","66","67","68","69","70","71","72","73","74","75","76","77","78","79","80","81","82","83","84","85","86","87","88","89","90","91","92","93","94","95","96","97","98","99","100","101","102","103","104","105","106","107","108","109","110","111","112","113","114","115","116","117","118","119","120","121","122","123","124","125","126","127","128","129","130","131","132","133","134","135","136","137","138","139","140","141","142","143","144","145","146","147","148","149","150","151","152","153","154","155","156","157","158","159","160","161","162","163","164","165","166","167","168","169","170","171","172","173","174","175","176","177","178","179","180","181","182","183","184","185","186","187","188","189","190","191","192","193","194","195","196","197","198","199","200","201","202","203","204","205","206","207","208","209","210","211","212","213","214","215","216","217","218","219","220","221","222","223","224","225","226","227","228","229","230","231","232","233","234","235","236","237","238","239","240","241","242","243","244","245","246","247","248","249","250","251","252","253","254","255","256","257","258","259","260","261","262","263","264","265","266","267","268","269","270","271","272","273","274","275","276","277","278","279","280","281","282","283","284","285","286","287","288","289","290","291","292","293","294","295","296","297","298","299","300","301","302","303","304","305","306","307","308","309","310","311","312","313","314","315","316","317","318","319","320","321","322","323","324","325","326","327","328","329","330","331","332","333","334","335","336","337","338","339","340","341","342","343","344","345","346","347","348","349","350","351","352","353","354","355","356","357","358","359","360","361","362","363","364","365","366","367","368","369","370","371","372","373","374","375","376","377","378","379","380","381","382","383","384","385","386","387","388","389","390","391","392","393","394","395","396","397","398","399","400","401","402","403","404","405","406","407","408","409","410","411","412","413","414","415","416","417","418","419","420","421","422","423","424","425","426","427","428","429","430","431","432","433","434","435","436","437","438","439","440","441","442","443","444","445","446","447","448","449","450","451","452","453","454","455","456","457","458","459","460","461","462","463","464","465","466","467","468","469","470","471","472","473","474","475","476","477","478","479","480","481","482","483","484","485","486","487","488","489","490","491","492","493","494","495","496","497","498","499","500","501","502","503","504","505","506","507","508","509","510","511","512","513","514","515","516","517","518","519","520","521","522","523","524","525","526","527","528","529","530","531","532","533","534","535","536","537","538","539","540","541","542","543","544","545","546","547","548","549","550","551","552","553","554","555","556","557","558","559","560","561","562","563","564","565","566","567","568","569","570","571","572","573","574","575","576","577","578","579","580","581","582","583","584","585","586","587","588","589","590","591","592","593","594","595","596","597","598","599","600","601","602","603","604","605","606","607","608","609","610","611","612","613","614","615","616","617","618","619","620","621","622","623","624","625","626","627","628","629","630","631","632","633","634","635","636","637","638","639","640","641","642","643","644","645","646","647","648","649","650","651","652","653","654","655","656","657","658","659","660","661","662","663","664","665","666","667","668","669","670","671","672","673","674","675","676","677","678","679","680","681","682","683","684","685","686","687","688","689","690","691","692","693","694","695","696","697","698","699","700","701","702","703","704","705","706","707","708","709","710","711","712","713","714","715","716","717","718","719","720","721","722","723","724","725","726","727","728","729","730","731","732","733","734","735","736","737","738","739","740","741","742","743","744","745","746","747","748","749","750","751","752","753","754","755","756","757","758","759","760","761","762","763","764","765","766","767","768","769","770","771","772","773","774","775","776","777","778","779","780","781","782","783","784","785","786","787","788","789","790","791","792","793","794","795","796","797","798","799","800","801","802","803","804","805","806","807","808","809","810","811","812","813","814","815","816","817","818","819","820","821","822","823","824","825","826","827","828","829","830","831","832","833","834","835","836","837","838","839","840","841","842","843","844","845","846","847","848","849","850","851","852","853","854","855","856","857","858","859","860","861","862","863","864","865","866","867","868","869","870","871","872","873","874","875","876","877","878","879","880","881","882","883","884","885","886","887","888","889","890","891","892","893","894","895","896","897","898","899","900","901","902","903","904","905","906","907","908","909","910","911","912","913","914","915","916","917","918","919","920","921","922","923","924","925","926","927","928","929","930","931","932","933","934","935","936","937","938","939","940","941","942","943","944","945","946","947","948","949","950","951","952","953","954","955","956","957","958","959","960","961","962","963","964","965","966","967","968","969","970","971","972","973","974","975","976","977","978","979","980","981","982","983","984","985","986","987","988","989","990","991","992","993","994","995","996","997","998","999","1000","1001","1002","1003","1004","1005","1006","1007","1008","1009","1010","1011","1012","1013","1014","1015","1016","1017","1018","1019","1020","1021","1022","1023","1024","1025","1026","1027","1028","1029","1030","1031","1032","1033","1034","1035","1036","1037","1038","1039","1040","1041","1042","1043","1044","1045","1046","1047","1048","1049","1050","1051","1052","1053","1054","1055","1056","1057","1058","1059","1060","1061","1062","1063","1064","1065","1066","1067","1068","1069","1070","1071","1072","1073","1074","1075","1076","1077","1078","1079","1080","1081","1082","1083","1084","1085","1086","1087","1088","1089","1090","1091","1092","1093","1094","1095","1096","1097","1098","1099","1100","1101","1102","1103","1104","1105","1106","1107","1108","1109","1110","1111","1112","1113","1114","1115","1116","1117","1118","1119","1120","1121","1122","1123","1124","1125","1126","1127","1128","1129","1130","1131","1132","1133","1134","1135","1136","1137","1138","1139","1140","1141","1142","1143","1144","1145","1146","1147","1148","1149","1150","1151","1152","1153","1154","1155","1156","1157","1158","1159","1160","1161","1162","1163","1164","1165","1166","1167","1168","1169","1170","1171","1172","1173","1174","1175","1176","1177","1178","1179","1180","1181","1182","1183","1184","1185","1186","1187","1188","1189","1190","1191","1192","1193","1194","1195","1196","1197","1198","1199","1200","1201","1202","1203","1204","1205","1206","1207","1208","1209","1210","1211","1212","1213","1214","1215","1216","1217","1218","1219","1220","1221","1222","1223","1224","1225","1226","1227","1228","1229","1230","1231","1232","1233","1234","1235","1236","1237","1238","1239","1240","1241","1242","1243","1244","1245","1246","1247","1248","1249","1250","1251","1252","1253","1254","1255","1256","1257","1258","1259","1260","1261","1262","1263","1264","1265","1266","1267","1268","1269","1270","1271","1272","1273","1274","1275","1276","1277","1278","1279","1280","1281","1282","1283","1284","1285","1286","1287","1288","1289","1290","1291","1292","1293","1294","1295","1296","1297","1298","1299","1300","1301","1302","1303","1304","1305","1306","1307","1308","1309","1310","1311","1312","1313","1314","1315","1316","1317","1318","1319","1320","1321","1322","1323","1324","1325","1326","1327","1328","1329","1330","1331","1332","1333","1334","1335","1336","1337","1338","1339","1340","1341","1342","1343","1344","1345","1346","1347","1348","1349","1350","1351","1352","1353","1354","1355","1356","1357","1358","1359","1360","1361","1362","1363","1364","1365","1366","1367","1368","1369","1370","1371","1372","1373","1374","1375","1376","1377","1378","1379","1380","1381","1382","1383","1384","1385","1386","1387","1388","1389","1390","1391","1392","1393","1394","1395","1396","1397","1398","1399","1400","1401","1402","1403","1404","1405","1406","1407","1408","1409","1410","1411","1412","1413","1414","1415","1416","1417","1418","1419","1420","1421","1422","1423","1424","1425","1426","1427","1428","1429","1430","1431","1432","1433","1434","1435","1436","1437","1438","1439","1440","1441","1442","1443","1444","1445","1446","1447","1448","1449","1450","1451","1452","1453","1454","1455","1456","1457","1458","1459","1460","1461","1462","1463","1464","1465","1466","1467","1468","1469","1470","1471","1472","1473","1474","1475","1476","1477","1478","1479","1480","1481","1482","1483","1484","1485","1486","1487","1488","1489","1490","1491","1492","1493","1494","1495","1496","1497","1498","1499","1500","1501","1502","1503","1504","1505","1506","1507","1508","1509","1510","1511","1512","1513","1514","1515","1516","1517","1518","1519","1520","1521","1522","1523","1524","1525","1526","1527","1528","1529","1530","1531","1532","1533","1534","1535","1536","1537","1538","1539","1540","1541","1542","1543","1544","1545","1546","1547","1548","1549","1550","1551","1552","1553","1554","1555","1556","1557","1558","1559","1560","1561","1562","1563","1564","1565","1566","1567","1568","1569","1570","1571","1572","1573","1574","1575","1576","1577","1578","1579","1580","1581","1582","1583","1584","1585","1586","1587","1588","1589","1590","1591","1592","1593","1594","1595","1596","1597","1598","1599","1600","1601","1602","1603","1604","1605","1606","1607","1608","1609","1610","1611","1612","1613","1614","1615","1616","1617","1618","1619","1620","1621","1622","1623","1624","1625","1626","1627","1628","1629","1630","1631","1632","1633","1634","1635","1636","1637","1638","1639","1640","1641","1642","1643","1644","1645","1646","1647","1648","1649","1650","1651","1652","1653","1654","1655","1656","1657","1658","1659","1660","1661","1662","1663","1664","1665","1666","1667","1668","1669","1670","1671","1672","1673","1674","1675","1676","1677","1678","1679","1680","1681","1682","1683","1684","1685","1686","1687","1688","1689","1690","1691","1692","1693","1694","1695","1696","1697","1698","1699","1700","1701","1702","1703","1704","1705","1706","1707","1708","1709","1710","1711","1712","1713","1714","1715","1716","1717","1718","1719","1720","1721","1722","1723","1724","1725","1726","1727","1728","1729","1730","1731","1732","1733","1734","1735","1736","1737","1738","1739","1740","1741","1742","1743","1744","1745","1746","1747","1748","1749","1750","1751","1752","1753","1754","1755","1756","1757","1758","1759","1760","1761","1762","1763","1764","1765","1766","1767","1768","1769","1770","1771","1772","1773","1774","1775","1776","1777","1778","1779","1780","1781","1782","1783","1784","1785","1786","1787","1788","1789","1790","1791","1792","1793","1794","1795","1796","1797","1798","1799","1800","1801","1802","1803","1804","1805","1806","1807","1808","1809","1810","1811","1812","1813","1814","1815","1816","1817","1818","1819","1820","1821","1822","1823","1824","1825","1826","1827","1828","1829","1830","1831","1832","1833","1834","1835","1836","1837","1838","1839","1840","1841","1842","1843","1844","1845","1846","1847","1848","1849","1850","1851","1852","1853","1854","1855","1856","1857","1858","1859","1860","1861","1862","1863","1864","1865","1866","1867","1868","1869","1870","1871","1872","1873","1874","1875","1876","1877","1878","1879","1880","1881","1882","1883","1884","1885","1886","1887","1888","1889","1890","1891","1892","1893","1894","1895","1896","1897","1898","1899","1900","1901","1902","1903","1904","1905","1906","1907","1908","1909","1910","1911","1912","1913","1914","1915","1916","1917","1918","1919","1920","1921","1922","1923","1924","1925","1926","1927","1928","1929","1930","1931","1932","1933","1934","1935","1936","1937","1938","1939","1940","1941","1942","1943","1944","1945","1946","1947","1948","1949","1950","1951","1952","1953","1954","1955","1956","1957","1958","1959","1960","1961","1962","1963","1964","1965","1966","1967","1968","1969","1970","1971","1972","1973","1974","1975","1976","1977","1978","1979","1980","1981","1982","1983","1984","1985","1986","1987","1988","1989","1990","1991","1992","1993","1994","1995","1996","1997","1998","1999","2000"],[1,2,3,4,5,6,7,8,9,10,11,12,13,14,15,16,17,18,19,20,1,2,3,4,5,6,7,8,9,10,11,12,13,14,15,16,17,18,19,20,1,2,3,4,5,6,7,8,9,10,11,12,13,14,15,16,17,18,1,2,3,4,5,6,7,8,9,10,11,12,13,14,15,16,17,18,19,20,21,22,23,1,2,3,4,5,6,7,8,9,10,11,12,13,14,15,16,17,18,19,20,21,1,2,3,4,5,6,7,8,9,10,11,12,13,14,15,16,17,18,19,20,1,2,3,4,5,6,7,8,9,10,11,12,13,14,15,16,17,18,19,20,21,1,2,3,4,5,6,7,8,9,10,11,12,13,14,15,16,17,18,19,20,1,2,3,4,5,6,7,8,9,10,11,12,13,14,15,16,17,18,19,20,1,2,3,4,5,6,7,8,9,10,11,12,13,14,15,16,17,18,19,20,21,22,23,24,1,2,3,4,5,6,7,8,9,10,11,12,13,14,15,16,17,18,19,20,21,22,1,2,3,4,5,6,7,8,9,10,11,12,13,14,15,16,17,2,3,4,5,6,7,8,9,10,11,12,13,14,15,16,17,18,19,20,21,1,2,3,4,5,6,7,8,9,10,11,12,13,14,15,16,17,1,2,3,4,5,6,7,8,9,10,11,12,13,14,15,16,17,18,19,20,21,22,23,24,1,2,3,4,5,6,7,8,9,10,11,12,13,14,15,16,17,1,2,3,4,5,6,7,8,9,10,11,12,13,14,15,16,17,18,19,20,21,22,23,24,25,26,1,2,3,4,5,6,7,8,9,10,11,12,13,14,15,16,17,18,19,20,21,1,2,3,4,5,6,7,8,9,10,11,12,14,15,16,17,18,19,20,21,1,2,3,4,5,6,7,8,9,10,11,12,13,14,15,17,18,19,20,21,1,2,3,4,5,6,7,8,9,10,11,12,13,14,15,16,17,18,19,20,21,22,23,1,2,3,4,5,6,7,8,9,10,11,12,13,14,15,16,17,18,19,20,1,2,3,4,5,6,7,8,9,10,11,12,13,14,15,16,17,18,19,20,21,22,1,2,3,4,5,6,7,8,9,10,11,12,13,14,15,16,17,18,19,1,2,3,4,5,6,7,8,9,10,11,12,13,14,15,16,17,18,19,20,1,2,3,4,5,6,7,8,9,10,11,12,13,14,15,16,17,18,19,20,21,1,2,3,4,5,6,7,8,9,10,11,12,13,14,15,16,17,18,19,20,1,2,3,4,5,6,7,8,9,10,11,12,13,14,15,16,17,18,19,20,1,2,3,4,5,6,7,8,9,10,12,13,14,15,16,17,18,1,2,3,4,5,6,7,8,9,10,11,12,13,14,15,16,17,1,2,4,5,6,7,8,9,10,11,12,13,14,15,16,17,18,19,20,1,2,3,4,5,6,7,8,9,10,11,12,13,14,15,16,17,18,19,20,21,22,23,1,2,3,4,5,6,7,8,9,10,11,12,13,14,15,16,17,18,19,1,2,3,4,5,6,7,8,9,10,11,12,13,14,15,16,17,18,19,20,21,22,1,2,3,4,5,6,7,8,9,10,11,12,13,14,15,16,17,18,19,20,1,2,3,4,5,6,7,8,9,10,11,12,13,14,15,16,17,18,19,1,2,3,4,5,6,7,8,9,10,11,12,13,14,15,16,17,18,19,1,2,3,4,5,6,7,8,9,10,11,12,13,14,15,16,17,1,2,3,4,5,6,7,8,9,10,11,12,13,14,15,16,1,2,3,4,5,6,7,8,9,10,11,12,13,14,15,16,17,18,19,20,1,2,3,4,5,6,7,8,9,10,11,12,13,14,15,16,17,18,19,1,2,3,4,5,6,7,8,9,10,11,12,13,14,15,16,17,18,19,20,21,1,2,3,4,5,6,7,8,9,10,11,12,13,14,15,16,17,1,2,3,4,5,6,7,8,9,10,11,12,13,14,15,16,17,18,19,1,2,3,4,5,6,7,8,9,10,11,12,13,14,15,16,17,18,19,1,2,3,4,5,6,7,8,9,10,11,12,13,14,15,16,17,18,19,20,21,22,23,1,2,3,4,5,6,7,8,9,10,11,12,13,14,15,16,17,1,2,3,4,5,6,7,8,9,10,11,12,13,14,15,16,17,18,19,1,2,3,4,5,6,7,8,9,10,11,12,13,14,15,16,17,18,19,20,1,2,3,4,5,6,7,8,9,10,11,12,13,14,15,16,17,18,19,20,1,2,3,4,5,6,7,8,9,10,11,12,13,14,15,16,17,18,19,20,21,22,23,1,2,3,4,5,6,7,8,9,10,11,12,13,14,15,16,17,18,19,20,21,22,23,1,2,3,4,5,6,7,8,9,10,11,12,13,14,15,16,17,18,19,1,2,3,4,5,6,7,8,9,10,11,12,13,14,15,16,17,18,19,1,2,3,4,5,6,7,8,9,10,11,12,13,14,15,16,17,18,19,20,21,1,2,3,4,5,6,7,8,9,10,11,12,13,14,15,16,17,18,19,1,2,3,4,5,6,7,8,9,10,11,12,13,14,15,16,17,18,1,2,3,4,5,6,7,8,9,10,11,12,13,14,15,16,17,18,19,20,1,2,3,4,5,6,7,8,9,10,11,12,13,14,15,16,17,1,2,3,4,5,6,7,8,9,10,11,12,13,14,16,17,18,19,20,21,22,1,2,3,4,5,6,7,8,9,10,11,12,13,14,15,16,17,18,19,1,2,3,4,5,6,7,8,9,10,11,12,13,14,15,16,17,18,19,20,1,2,3,4,5,6,7,8,9,10,11,12,13,14,15,16,17,18,19,20,21,22,23,24,25,1,2,3,4,5,6,7,8,9,11,12,13,14,15,16,17,18,19,20,1,2,3,4,5,6,7,8,9,10,11,12,13,14,15,16,17,18,19,20,21,22,1,2,3,4,5,6,7,8,9,10,11,12,13,14,15,16,17,18,19,20,1,2,3,4,5,6,7,8,9,10,11,12,13,14,15,16,17,18,19,20,21,1,2,3,4,5,6,7,8,9,10,11,12,13,14,15,16,17,1,2,4,5,6,7,8,9,10,11,12,13,14,15,16,17,18,19,1,2,3,4,5,6,7,8,9,10,11,12,13,14,15,16,17,18,19,20,21,1,2,3,4,5,6,7,8,9,10,11,12,13,14,15,16,17,18,19,20,21,22,1,2,3,4,5,6,7,8,9,10,11,12,13,14,15,16,17,18,19,20,21,1,2,3,4,5,6,7,8,9,10,11,12,13,14,15,16,17,18,19,20,1,2,3,4,5,6,7,8,9,10,11,12,13,14,15,16,17,1,2,3,4,5,6,7,8,9,10,11,12,13,14,15,16,17,1,2,3,4,5,6,7,8,9,10,11,12,13,14,15,16,17,18,1,2,3,4,5,6,7,8,9,10,11,12,13,14,15,16,17,18,19,1,2,3,4,5,6,7,8,9,10,11,12,13,14,15,16,17,18,1,2,3,4,5,6,7,8,9,10,11,12,13,14,15,16,17,18,19,20,1,2,3,4,5,6,7,8,9,10,11,12,13,14,15,16,17,18,19,20,1,2,3,4,5,6,7,8,9,10,11,12,13,14,15,16,17,18,19,20,21,1,2,3,4,5,6,7,8,9,10,11,12,13,14,15,16,17,18,19,20,21,1,2,3,4,5,6,7,8,9,10,11,12,13,14,15,16,17,18,1,2,3,4,5,6,7,8,9,10,11,12,13,14,15,16,17,18,19,20,21,1,2,3,4,5,6,7,8,9,10,11,12,13,14,15,16,17,18,19,20,21,22,1,2,3,4,5,6,7,8,9,10,11,12,13,14,15,16,17,18,19,20,21,22,1,2,3,4,5,6,7,8,9,10,11,12,13,14,15,16,17,18,19,20,21,1,2,3,4,5,6,7,8,9,10,11,12,13,14,15,16,17,18,19,20,21,22,23,1,2,3,4,5,6,7,8,9,10,11,12,13,14,15,16,17,18,1,2,3,4,5,6,7,8,9,10,11,12,13,14,15,16,17,18,19,20,21,22,23,1,2,3,4,5,6,7,8,9,10,11,12,13,14,15,16,17,18,1,2,3,4,5,6,7,8,9,10,11,12,13,14,15,16,17,1,2,3,4,5,6,7,8,9,10,11,12,13,14,15,16,17,18,19,20,1,2,3,4,5,6,7,8,9,10,11,12,13,14,15,16,1,2,3,4,5,6,7,8,9,10,11,12,13,14,15,16,17,18,19,20,21,1,2,3,4,5,6,7,8,9,10,11,12,13,14,15,16,17,18,19,20,21,1,2,3,4,5,6,7,8,9,10,11,12,13,14,15,16,17,18,19,20,21,1,2,3,4,5,6,7,8,9,10,11,12,13,14,15,16,17,18,19,20,21,1,2,3,4,5,6,7,8,9,10,11,12,13,14,15,16,17,18,19,20,21,22,23,1,2,3,4,5,6,7,8,9,10,11,12,13,14,15,16,17,18,19,20],[1,1,1,1,1,1,1,1,1,1,1,1,1,1,1,1,1,1,1,1,2,2,2,2,2,2,2,2,2,2,2,2,2,2,2,2,2,2,2,2,3,3,3,3,3,3,3,3,3,3,3,3,3,3,3,3,3,3,4,4,4,4,4,4,4,4,4,4,4,4,4,4,4,4,4,4,4,4,4,4,4,5,5,5,5,5,5,5,5,5,5,5,5,5,5,5,5,5,5,5,5,5,6,6,6,6,6,6,6,6,6,6,6,6,6,6,6,6,6,6,6,6,7,7,7,7,7,7,7,7,7,7,7,7,7,7,7,7,7,7,7,7,7,8,8,8,8,8,8,8,8,8,8,8,8,8,8,8,8,8,8,8,8,9,9,9,9,9,9,9,9,9,9,9,9,9,9,9,9,9,9,9,9,10,10,10,10,10,10,10,10,10,10,10,10,10,10,10,10,10,10,10,10,10,10,10,10,11,11,11,11,11,11,11,11,11,11,11,11,11,11,11,11,11,11,11,11,11,11,12,12,12,12,12,12,12,12,12,12,12,12,12,12,12,12,12,13,13,13,13,13,13,13,13,13,13,13,13,13,13,13,13,13,13,13,13,14,14,14,14,14,14,14,14,14,14,14,14,14,14,14,14,14,15,15,15,15,15,15,15,15,15,15,15,15,15,15,15,15,15,15,15,15,15,15,15,15,16,16,16,16,16,16,16,16,16,16,16,16,16,16,16,16,16,17,17,17,17,17,17,17,17,17,17,17,17,17,17,17,17,17,17,17,17,17,17,17,17,17,17,18,18,18,18,18,18,18,18,18,18,18,18,18,18,18,18,18,18,18,18,18,19,19,19,19,19,19,19,19,19,19,19,19,19,19,19,19,19,19,19,19,20,20,20,20,20,20,20,20,20,20,20,20,20,20,20,20,20,20,20,20,21,21,21,21,21,21,21,21,21,21,21,21,21,21,21,21,21,21,21,21,21,21,21,22,22,22,22,22,22,22,22,22,22,22,22,22,22,22,22,22,22,22,22,23,23,23,23,23,23,23,23,23,23,23,23,23,23,23,23,23,23,23,23,23,23,24,24,24,24,24,24,24,24,24,24,24,24,24,24,24,24,24,24,24,25,25,25,25,25,25,25,25,25,25,25,25,25,25,25,25,25,25,25,25,26,26,26,26,26,26,26,26,26,26,26,26,26,26,26,26,26,26,26,26,26,27,27,27,27,27,27,27,27,27,27,27,27,27,27,27,27,27,27,27,27,28,28,28,28,28,28,28,28,28,28,28,28,28,28,28,28,28,28,28,28,29,29,29,29,29,29,29,29,29,29,29,29,29,29,29,29,29,30,30,30,30,30,30,30,30,30,30,30,30,30,30,30,30,30,31,31,31,31,31,31,31,31,31,31,31,31,31,31,31,31,31,31,31,32,32,32,32,32,32,32,32,32,32,32,32,32,32,32,32,32,32,32,32,32,32,32,33,33,33,33,33,33,33,33,33,33,33,33,33,33,33,33,33,33,33,34,34,34,34,34,34,34,34,34,34,34,34,34,34,34,34,34,34,34,34,34,34,35,35,35,35,35,35,35,35,35,35,35,35,35,35,35,35,35,35,35,35,36,36,36,36,36,36,36,36,36,36,36,36,36,36,36,36,36,36,36,37,37,37,37,37,37,37,37,37,37,37,37,37,37,37,37,37,37,37,38,38,38,38,38,38,38,38,38,38,38,38,38,38,38,38,38,39,39,39,39,39,39,39,39,39,39,39,39,39,39,39,39,40,40,40,40,40,40,40,40,40,40,40,40,40,40,40,40,40,40,40,40,41,41,41,41,41,41,41,41,41,41,41,41,41,41,41,41,41,41,41,42,42,42,42,42,42,42,42,42,42,42,42,42,42,42,42,42,42,42,42,42,43,43,43,43,43,43,43,43,43,43,43,43,43,43,43,43,43,44,44,44,44,44,44,44,44,44,44,44,44,44,44,44,44,44,44,44,45,45,45,45,45,45,45,45,45,45,45,45,45,45,45,45,45,45,45,46,46,46,46,46,46,46,46,46,46,46,46,46,46,46,46,46,46,46,46,46,46,46,47,47,47,47,47,47,47,47,47,47,47,47,47,47,47,47,47,48,48,48,48,48,48,48,48,48,48,48,48,48,48,48,48,48,48,48,49,49,49,49,49,49,49,49,49,49,49,49,49,49,49,49,49,49,49,49,50,50,50,50,50,50,50,50,50,50,50,50,50,50,50,50,50,50,50,50,51,51,51,51,51,51,51,51,51,51,51,51,51,51,51,51,51,51,51,51,51,51,51,52,52,52,52,52,52,52,52,52,52,52,52,52,52,52,52,52,52,52,52,52,52,52,53,53,53,53,53,53,53,53,53,53,53,53,53,53,53,53,53,53,53,54,54,54,54,54,54,54,54,54,54,54,54,54,54,54,54,54,54,54,55,55,55,55,55,55,55,55,55,55,55,55,55,55,55,55,55,55,55,55,55,56,56,56,56,56,56,56,56,56,56,56,56,56,56,56,56,56,56,56,57,57,57,57,57,57,57,57,57,57,57,57,57,57,57,57,57,57,58,58,58,58,58,58,58,58,58,58,58,58,58,58,58,58,58,58,58,58,59,59,59,59,59,59,59,59,59,59,59,59,59,59,59,59,59,60,60,60,60,60,60,60,60,60,60,60,60,60,60,60,60,60,60,60,60,60,61,61,61,61,61,61,61,61,61,61,61,61,61,61,61,61,61,61,61,62,62,62,62,62,62,62,62,62,62,62,62,62,62,62,62,62,62,62,62,63,63,63,63,63,63,63,63,63,63,63,63,63,63,63,63,63,63,63,63,63,63,63,63,63,64,64,64,64,64,64,64,64,64,64,64,64,64,64,64,64,64,64,64,65,65,65,65,65,65,65,65,65,65,65,65,65,65,65,65,65,65,65,65,65,65,66,66,66,66,66,66,66,66,66,66,66,66,66,66,66,66,66,66,66,66,67,67,67,67,67,67,67,67,67,67,67,67,67,67,67,67,67,67,67,67,67,68,68,68,68,68,68,68,68,68,68,68,68,68,68,68,68,68,69,69,69,69,69,69,69,69,69,69,69,69,69,69,69,69,69,69,70,70,70,70,70,70,70,70,70,70,70,70,70,70,70,70,70,70,70,70,70,71,71,71,71,71,71,71,71,71,71,71,71,71,71,71,71,71,71,71,71,71,71,72,72,72,72,72,72,72,72,72,72,72,72,72,72,72,72,72,72,72,72,72,73,73,73,73,73,73,73,73,73,73,73,73,73,73,73,73,73,73,73,73,74,74,74,74,74,74,74,74,74,74,74,74,74,74,74,74,74,75,75,75,75,75,75,75,75,75,75,75,75,75,75,75,75,75,76,76,76,76,76,76,76,76,76,76,76,76,76,76,76,76,76,76,77,77,77,77,77,77,77,77,77,77,77,77,77,77,77,77,77,77,77,78,78,78,78,78,78,78,78,78,78,78,78,78,78,78,78,78,78,79,79,79,79,79,79,79,79,79,79,79,79,79,79,79,79,79,79,79,79,80,80,80,80,80,80,80,80,80,80,80,80,80,80,80,80,80,80,80,80,81,81,81,81,81,81,81,81,81,81,81,81,81,81,81,81,81,81,81,81,81,82,82,82,82,82,82,82,82,82,82,82,82,82,82,82,82,82,82,82,82,82,83,83,83,83,83,83,83,83,83,83,83,83,83,83,83,83,83,83,84,84,84,84,84,84,84,84,84,84,84,84,84,84,84,84,84,84,84,84,84,85,85,85,85,85,85,85,85,85,85,85,85,85,85,85,85,85,85,85,85,85,85,86,86,86,86,86,86,86,86,86,86,86,86,86,86,86,86,86,86,86,86,86,86,87,87,87,87,87,87,87,87,87,87,87,87,87,87,87,87,87,87,87,87,87,88,88,88,88,88,88,88,88,88,88,88,88,88,88,88,88,88,88,88,88,88,88,88,89,89,89,89,89,89,89,89,89,89,89,89,89,89,89,89,89,89,90,90,90,90,90,90,90,90,90,90,90,90,90,90,90,90,90,90,90,90,90,90,90,91,91,91,91,91,91,91,91,91,91,91,91,91,91,91,91,91,91,92,92,92,92,92,92,92,92,92,92,92,92,92,92,92,92,92,93,93,93,93,93,93,93,93,93,93,93,93,93,93,93,93,93,93,93,93,94,94,94,94,94,94,94,94,94,94,94,94,94,94,94,94,95,95,95,95,95,95,95,95,95,95,95,95,95,95,95,95,95,95,95,95,95,96,96,96,96,96,96,96,96,96,96,96,96,96,96,96,96,96,96,96,96,96,97,97,97,97,97,97,97,97,97,97,97,97,97,97,97,97,97,97,97,97,97,98,98,98,98,98,98,98,98,98,98,98,98,98,98,98,98,98,98,98,98,98,99,99,99,99,99,99,99,99,99,99,99,99,99,99,99,99,99,99,99,99,99,99,99,100,100,100,100,100,100,100,100,100,100,100,100,100,100,100,100,100,100,100,100],[5,7,4,3,5,4,5,4,5,5,5,5,5,5,5,6,4,4,7,4,8,4,6,5,5,5,4,5,6,4,6,4,4,3,6,5,5,3,4,5,5,5,4,4,6,5,5,7,4,7,6,4,5,4,6,7,6,4,3,2,5,6,6,3,6,4,5,6,6,4,3,5,6,5,4,5,4,6,4,5,7,7,4,5,4,6,7,6,4,6,8,7,6,7,6,6,5,6,6,6,5,6,4,6,5,5,4,4,6,5,4,7,5,6,5,3,4,6,5,7,5,4,6,4,4,4,4,5,4,5,6,5,5,6,4,4,7,5,6,5,5,7,5,6,5,4,7,6,7,6,5,6,5,4,5,5,5,7,5,5,7,6,5,6,5,5,6,6,5,5,5,5,5,3,4,4,5,4,6,6,7,6,4,5,6,5,4,5,6,5,5,6,5,6,6,7,6,3,5,3,6,3,6,4,6,4,5,4,5,5,6,5,6,5,7,4,5,6,6,6,6,4,5,5,6,4,5,5,4,5,4,2,7,4,3,4,6,5,3,4,3,4,4,4,5,6,4,4,6,6,5,4,6,6,6,7,3,4,4,6,6,4,7,5,5,4,7,6,9,7,6,8,5,6,6,8,7,7,7,7,6,8,6,5,5,4,4,7,6,6,8,5,8,5,7,6,5,6,5,6,6,6,4,3,5,5,4,5,6,5,7,5,5,6,8,5,6,8,6,7,5,4,6,6,4,3,6,5,3,5,6,4,5,5,6,4,6,6,6,6,3,5,4,7,5,4,4,4,5,4,7,5,4,5,5,4,5,3,5,4,5,6,5,4,5,5,6,5,4,3,5,8,4,5,5,5,3,5,4,5,4,6,4,6,5,3,5,4,5,3,4,5,7,5,4,5,6,8,5,5,4,4,6,7,4,6,5,6,5,6,5,5,5,5,4,7,5,5,4,6,3,6,6,4,4,5,4,5,4,3,6,4,5,6,3,2,6,6,5,4,4,6,4,5,5,6,6,7,5,5,4,6,5,7,6,6,4,5,5,7,5,4,6,5,5,6,4,6,5,6,5,5,7,3,7,3,5,4,5,5,7,7,7,6,5,6,7,6,6,5,5,7,5,5,6,4,5,5,4,7,6,5,6,4,5,6,6,5,4,5,4,5,5,5,5,5,4,6,4,4,4,6,5,4,4,6,5,4,6,4,3,7,4,7,5,4,4,6,6,5,4,7,5,7,5,5,5,6,5,5,4,5,5,4,6,6,5,3,3,5,6,6,6,5,6,5,6,5,6,7,5,6,5,4,3,4,4,4,5,7,4,4,6,5,4,5,3,3,5,5,5,3,2,6,5,5,7,5,6,6,8,5,5,6,5,4,5,8,6,8,6,6,6,6,5,5,6,5,5,6,5,3,4,4,4,6,3,6,5,5,6,6,6,6,4,4,5,3,4,6,6,5,4,5,5,5,5,6,6,4,5,6,7,7,7,8,6,7,8,7,8,8,9,6,7,6,7,7,7,9,6,6,5,8,7,6,5,6,7,4,6,6,4,5,5,3,6,5,7,6,5,6,5,4,5,6,4,4,5,6,4,4,7,4,6,3,6,4,5,6,4,5,3,6,4,5,4,6,3,3,4,6,4,3,5,3,4,7,6,5,4,4,5,5,6,6,5,6,7,5,6,6,4,4,4,5,5,4,6,7,6,5,5,5,5,5,5,4,6,4,4,4,6,4,5,5,6,5,4,4,4,6,4,4,7,5,5,5,6,5,4,3,4,6,8,8,9,9,8,10,9,10,9,8,7,10,8,9,10,9,8,6,8,8,6,3,5,5,6,5,5,5,5,4,6,5,5,6,5,4,3,5,4,3,7,5,5,5,4,3,5,5,7,7,5,6,3,6,6,6,5,5,4,4,7,5,5,4,6,4,6,5,5,5,5,4,6,5,7,4,6,5,6,6,6,5,5,4,5,6,4,6,8,5,7,7,5,6,5,5,6,6,5,7,6,4,5,3,6,6,5,5,4,6,4,5,6,5,5,4,4,6,4,4,4,6,4,4,6,5,6,6,5,4,5,8,3,2,6,3,4,4,4,8,5,5,6,4,5,6,6,4,5,5,5,5,4,4,7,6,4,7,5,6,6,4,8,4,5,5,5,6,8,7,6,6,5,5,4,6,4,7,5,5,5,6,5,5,5,6,6,5,6,5,6,8,4,5,4,6,5,5,6,2,5,5,7,5,6,5,4,5,5,5,5,6,5,4,5,4,5,6,5,4,5,5,5,5,5,6,3,5,5,6,5,5,5,3,5,6,5,6,3,6,5,4,4,6,6,5,5,6,5,2,5,5,5,7,5,5,6,6,6,6,3,5,4,5,4,5,7,5,6,4,1,4,4,5,5,6,6,5,4,4,6,5,5,6,4,5,5,7,4,5,6,5,5,6,6,4,6,4,5,6,6,5,5,3,6,6,5,7,7,6,5,5,6,6,4,7,6,5,4,5,4,6,4,6,5,5,3,6,4,6,5,5,5,4,4,6,5,5,6,8,6,7,7,6,5,5,5,6,5,7,4,7,2,7,8,5,4,6,5,6,6,3,6,3,4,5,6,2,6,4,5,5,4,5,5,3,6,5,6,5,5,6,5,6,5,7,6,4,4,6,6,5,6,5,8,9,7,6,7,8,5,6,7,8,7,6,7,7,7,7,4,5,6,4,3,6,4,3,4,5,4,6,4,4,5,3,6,5,4,5,4,4,5,5,5,5,6,3,4,5,4,4,6,4,6,4,6,5,5,4,5,5,5,6,5,3,4,6,5,7,5,5,5,6,5,7,5,6,5,4,4,4,4,7,4,5,4,4,2,4,4,5,3,3,5,5,6,6,5,2,7,5,5,5,3,6,6,5,3,4,5,4,5,5,4,7,5,5,6,4,4,5,5,4,5,3,5,4,6,7,7,5,5,5,5,6,6,5,6,6,5,4,5,7,6,4,4,7,5,6,8,6,3,7,5,5,4,4,7,5,6,4,5,4,4,1,7,5,5,6,3,6,5,5,4,6,6,6,5,4,4,6,5,3,4,4,4,5,5,4,3,6,5,3,5,4,5,3,3,4,5,5,5,5,6,4,4,6,4,5,4,5,6,3,4,6,7,5,5,5,4,4,5,7,1,3,3,5,3,4,7,4,7,6,4,5,4,6,5,4,5,4,3,3,3,4,5,3,5,4,6,5,5,5,6,7,5,5,6,4,4,4,6,4,5,5,4,6,5,3,6,5,5,6,5,6,5,5,4,6,4,5,4,6,3,5,5,6,4,6,5,5,5,6,5,5,7,5,6,5,6,5,5,3,5,4,4,6,4,5,6,4,3,6,4,5,3,5,6,6,5,5,5,6,5,5,5,6,5,6,3,5,5,5,5,5,4,5,5,4,4,8,7,6,7,7,5,6,5,7,6,5,6,7,7,5,6,6,7,7,5,6,4,7,5,5,6,6,5,3,4,6,3,7,6,4,3,7,6,6,6,4,7,4,5,5,3,5,6,6,5,5,6,4,5,6,5,6,4,4,4,5,5,6,4,4,6,5,6,5,5,5,6,5,2,4,6,4,4,6,6,6,6,5,5,5,6,4,7,5,6,7,5,4,6,5,6,5,7,4,5,6,9,5,5,7,6,5,5,5,5,4,6,6,5,6,6,6,5,7,4,6,5,6,7,5,7,3,5,5,4,6,5,4,4,6,7,5,5,4,5,5,6,6,3,5,5,5,6,5,4,5,5,5,4,5,4,4,3,7,3,6,5,6,6,4,5,4,5,7,5,5,6,4,5,5,5,4,4,7,4,4,6,7,7,6,6,7,7,7,6,6,5,7,5,6,7,8,4,6,4,4,7,7,7,8,10,8,8,6,9,8,8,5,6,9,8,8,7,10,9,8,9,8,6,4,6,5,5,4,5,4,6,5,6,4,4,7,4,3,5,5,5,7,4,4,4,4,7,5,5,6,5,5,5,4,5,7,6,6,4,5,5,5,6,7,6,7,7,5,7,9,6,7,7,7,8,8,8,7,9,8,7,8,6,7,6,8,7,4,3,5,5,4,7,4,5,5,6,5,4,7,4,5,7,7,4,4,4,4,4,6,4,5,4,3,5,6,3,4,4,5,4,5,7,4,5,6,5,7,5,5,5,6,6,5,7,6,3,5,5,4,5,5,5,4,5,6,6,6,6,5,5,2,5,7,3,4,4,5,5,3,7,5,3,5,4,5,5,6,6,6,4,5,5,5,6,7,5,4,6,5,6,6,5,6,6,6,4,4,5,4,8,5,5,6,4,3,5,4,5,5,7,5,3,4,5,5,4,5,5,4,4,4,4,3,6,4,7,6,5,5,3,4,4,6,5,7,5,5,5,3,5,6,6,5,6,5,4,4,7,5,6,5,5,3,5,5,4,6,6,5,5,4,6,4,5,4,5,3,4,5,5,5,5,5,5,6,7,3,7,7,7,5,5,5,5,6,7,5,5,4,4,8,5,9],["girl","boy","girl","girl","girl","boy","boy","boy","boy","boy","girl","girl","boy","girl","girl","girl","boy","boy","girl","boy","girl","boy","boy","girl","girl","boy","girl","boy","girl","girl","girl","boy","boy","boy","boy","girl","girl","girl","boy","boy","boy","girl","girl","girl","boy","girl","boy","girl","girl","girl","girl","girl","girl","girl","boy","boy","girl","boy","girl","girl","girl","girl","girl","boy","boy","boy","boy","girl","boy","boy","boy","boy","boy","girl","girl","boy","boy","boy","boy","girl","boy","boy","girl","boy","girl","boy","boy","boy","girl","girl","boy","girl","girl","boy","girl","boy","girl","girl","boy","girl","boy","boy","boy","girl","girl","girl","girl","girl","boy","boy","girl","girl","boy","girl","girl","boy","girl","boy","boy","boy","boy","boy","girl","girl","boy","boy","boy","girl","boy","girl","boy","girl","boy","boy","boy","girl","boy","boy","girl","boy","girl","girl","boy","girl","boy","girl","girl","boy","girl","boy","girl","boy","girl","boy","boy","boy","girl","boy","boy","girl","girl","girl","girl","boy","girl","girl","girl","girl","boy","boy","boy","boy","boy","boy","girl","boy","boy","boy","boy","girl","girl","girl","boy","boy","girl","boy","girl","boy","girl","boy","boy","girl","girl","boy","boy","girl","boy","boy","boy","boy","boy","girl","girl","girl","girl","girl","girl","boy","girl","girl","boy","boy","girl","boy","girl","girl","girl","boy","boy","boy","girl","girl","boy","boy","boy","boy","girl","girl","boy","boy","girl","girl","girl","girl","boy","boy","boy","girl","girl","boy","boy","girl","boy","boy","boy","boy","girl","girl","boy","boy","girl","girl","boy","girl","boy","boy","girl","girl","boy","girl","boy","boy","girl","girl","girl","girl","boy","boy","boy","boy","boy","boy","boy","boy","boy","boy","boy","boy","boy","boy","boy","boy","boy","boy","boy","boy","boy","boy","girl","girl","girl","boy","boy","girl","boy","boy","girl","boy","girl","boy","girl","boy","girl","boy","boy","boy","boy","girl","girl","girl","girl","girl","boy","girl","boy","girl","girl","girl","girl","girl","boy","girl","girl","girl","boy","girl","boy","boy","girl","boy","girl","girl","girl","girl","girl","boy","boy","girl","boy","girl","girl","girl","boy","girl","girl","boy","boy","boy","boy","boy","boy","girl","boy","boy","boy","girl","boy","girl","boy","girl","boy","girl","boy","boy","girl","boy","boy","girl","girl","girl","boy","girl","boy","boy","girl","boy","boy","boy","girl","boy","girl","girl","boy","girl","girl","boy","girl","girl","boy","girl","boy","girl","girl","girl","girl","girl","girl","girl","boy","girl","boy","boy","girl","boy","girl","girl","boy","girl","girl","girl","boy","girl","girl","girl","girl","boy","boy","boy","girl","boy","boy","girl","boy","boy","boy","girl","boy","boy","girl","girl","girl","girl","girl","girl","girl","girl","girl","girl","boy","boy","boy","girl","girl","boy","boy","boy","girl","girl","boy","girl","boy","girl","girl","girl","boy","girl","girl","boy","girl","girl","girl","boy","boy","boy","boy","girl","boy","girl","girl","boy","girl","boy","girl","boy","boy","boy","boy","boy","girl","girl","girl","girl","boy","girl","boy","girl","boy","boy","boy","boy","boy","girl","girl","girl","boy","boy","girl","girl","girl","girl","boy","boy","girl","girl","boy","girl","boy","girl","girl","girl","boy","boy","boy","boy","boy","girl","girl","boy","girl","boy","girl","girl","boy","boy","boy","girl","boy","girl","boy","boy","girl","girl","girl","boy","boy","girl","boy","boy","boy","boy","boy","boy","boy","boy","girl","boy","girl","girl","boy","girl","girl","girl","boy","boy","boy","boy","boy","girl","boy","boy","girl","girl","boy","girl","girl","girl","boy","boy","girl","boy","girl","boy","girl","boy","girl","girl","girl","boy","boy","boy","girl","girl","boy","girl","girl","girl","boy","boy","girl","girl","girl","girl","boy","boy","boy","girl","boy","girl","boy","boy","girl","boy","girl","boy","girl","girl","boy","girl","girl","girl","boy","girl","girl","girl","boy","girl","girl","girl","boy","boy","boy","boy","boy","boy","boy","girl","boy","boy","girl","girl","boy","girl","girl","boy","boy","boy","girl","boy","girl","girl","boy","girl","boy","girl","boy","boy","boy","boy","girl","boy","girl","girl","girl","girl","girl","girl","girl","girl","girl","girl","girl","girl","girl","girl","girl","girl","girl","girl","girl","girl","girl","boy","boy","girl","boy","boy","boy","boy","boy","girl","boy","boy","girl","boy","boy","girl","boy","boy","girl","boy","boy","girl","girl","girl","girl","girl","girl","girl","girl","girl","girl","girl","girl","girl","girl","girl","girl","girl","girl","girl","girl","girl","girl","girl","boy","boy","boy","boy","girl","girl","girl","boy","girl","boy","boy","girl","girl","boy","girl","boy","boy","boy","boy","girl","girl","girl","boy","boy","boy","girl","boy","boy","girl","boy","boy","boy","boy","boy","boy","girl","girl","boy","boy","boy","girl","girl","girl","girl","boy","girl","boy","boy","boy","boy","boy","girl","girl","boy","girl","girl","boy","boy","girl","girl","girl","girl","girl","girl","boy","boy","boy","girl","boy","girl","girl","girl","girl","girl","girl","girl","girl","girl","girl","girl","girl","girl","girl","girl","girl","girl","girl","girl","girl","girl","girl","boy","boy","girl","boy","boy","boy","girl","girl","girl","girl","boy","boy","boy","girl","girl","girl","girl","boy","girl","boy","boy","girl","boy","girl","boy","girl","girl","girl","boy","girl","girl","girl","boy","boy","girl","boy","girl","girl","girl","boy","girl","boy","girl","girl","girl","boy","boy","girl","boy","boy","boy","boy","boy","boy","boy","boy","boy","girl","girl","girl","boy","boy","girl","boy","boy","boy","boy","girl","girl","girl","girl","boy","boy","girl","boy","boy","girl","girl","girl","boy","boy","boy","girl","boy","girl","boy","boy","boy","boy","boy","boy","girl","boy","boy","girl","girl","girl","boy","boy","boy","girl","girl","boy","girl","girl","girl","girl","girl","boy","boy","girl","boy","girl","girl","girl","girl","boy","girl","boy","girl","boy","boy","girl","boy","girl","girl","girl","boy","girl","boy","boy","girl","girl","boy","girl","boy","boy","boy","boy","boy","girl","girl","boy","girl","boy","boy","girl","girl","boy","girl","girl","boy","boy","girl","girl","boy","girl","girl","boy","girl","boy","boy","girl","girl","girl","girl","boy","girl","boy","boy","girl","boy","boy","boy","girl","girl","boy","boy","girl","boy","boy","boy","boy","girl","boy","girl","boy","boy","girl","boy","girl","girl","girl","boy","girl","boy","girl","girl","girl","girl","boy","girl","girl","boy","boy","boy","girl","girl","boy","girl","girl","boy","boy","girl","girl","boy","girl","boy","girl","girl","girl","boy","boy","boy","girl","girl","girl","boy","boy","boy","boy","boy","girl","boy","girl","boy","girl","girl","boy","girl","girl","girl","girl","girl","girl","girl","girl","girl","girl","girl","girl","girl","girl","girl","girl","girl","girl","girl","girl","boy","boy","boy","boy","boy","girl","boy","boy","boy","girl","boy","boy","girl","girl","girl","boy","girl","girl","boy","boy","boy","boy","boy","boy","boy","boy","boy","boy","boy","boy","boy","boy","boy","boy","boy","boy","boy","boy","boy","boy","boy","girl","boy","boy","girl","girl","boy","boy","girl","girl","girl","girl","boy","boy","girl","boy","boy","girl","girl","girl","boy","boy","girl","girl","boy","girl","girl","boy","girl","girl","boy","girl","boy","girl","boy","girl","boy","girl","girl","girl","boy","boy","girl","boy","girl","boy","girl","boy","girl","boy","girl","girl","girl","girl","boy","boy","boy","girl","girl","boy","boy","boy","boy","girl","girl","boy","boy","boy","girl","girl","girl","boy","boy","boy","girl","boy","girl","girl","boy","girl","girl","boy","boy","girl","boy","girl","girl","girl","girl","boy","boy","boy","girl","boy","girl","boy","girl","girl","girl","boy","girl","girl","boy","girl","girl","boy","girl","girl","boy","boy","girl","boy","boy","girl","boy","boy","boy","boy","girl","girl","girl","girl","girl","girl","girl","boy","boy","boy","girl","boy","boy","girl","boy","girl","boy","girl","boy","boy","boy","boy","girl","boy","girl","boy","girl","boy","boy","girl","girl","boy","girl","boy","girl","girl","girl","girl","boy","boy","girl","girl","girl","girl","girl","girl","girl","girl","girl","girl","girl","girl","girl","girl","girl","girl","girl","girl","girl","boy","boy","boy","girl","girl","girl","boy","boy","boy","girl","girl","boy","boy","girl","boy","girl","boy","boy","boy","girl","girl","girl","girl","girl","boy","boy","girl","girl","girl","girl","girl","girl","boy","girl","girl","girl","girl","boy","boy","boy","girl","boy","girl","girl","girl","girl","girl","girl","girl","girl","girl","girl","girl","girl","girl","girl","girl","girl","girl","girl","girl","girl","girl","boy","boy","boy","boy","boy","girl","boy","boy","girl","girl","boy","boy","girl","girl","boy","boy","boy","boy","girl","boy","girl","boy","boy","boy","girl","boy","girl","boy","boy","boy","girl","boy","girl","girl","girl","girl","girl","girl","girl","girl","girl","boy","boy","boy","girl","boy","boy","boy","boy","girl","boy","girl","girl","boy","boy","boy","boy","boy","boy","girl","boy","boy","girl","girl","boy","girl","boy","girl","girl","boy","girl","girl","boy","boy","girl","girl","girl","girl","boy","boy","boy","boy","boy","boy","girl","girl","boy","boy","boy","boy","girl","boy","boy","boy","boy","boy","girl","boy","boy","girl","girl","girl","girl","boy","boy","boy","girl","girl","boy","girl","girl","boy","boy","boy","boy","boy","girl","girl","boy","girl","boy","girl","boy","boy","girl","boy","boy","boy","boy","boy","girl","girl","boy","girl","girl","boy","girl","girl","girl","girl","girl","girl","girl","girl","girl","girl","girl","girl","girl","girl","girl","girl","girl","boy","girl","boy","girl","girl","boy","boy","girl","girl","boy","boy","girl","boy","boy","boy","girl","girl","boy","boy","girl","girl","girl","girl","boy","girl","boy","girl","boy","boy","boy","boy","boy","boy","boy","girl","girl","boy","boy","girl","girl","boy","boy","girl","boy","girl","boy","boy","boy","boy","girl","girl","boy","boy","girl","girl","girl","boy","boy","boy","girl","boy","boy","boy","boy","girl","girl","girl","girl","boy","girl","boy","boy","boy","boy","boy","boy","girl","boy","girl","boy","boy","boy","girl","girl","boy","boy","boy","girl","girl","boy","boy","boy","girl","girl","girl","boy","boy","boy","girl","girl","girl","boy","girl","girl","boy","boy","girl","boy","girl","boy","boy","boy","girl","girl","boy","boy","boy","boy","boy","boy","boy","boy","boy","boy","boy","boy","boy","boy","boy","boy","boy","boy","boy","boy","boy","boy","boy","boy","boy","girl","girl","girl","boy","girl","girl","girl","boy","girl","girl","girl","girl","boy","girl","boy","boy","girl","boy","girl","girl","boy","boy","girl","boy","boy","girl","girl","boy","boy","boy","girl","girl","boy","girl","girl","girl","boy","girl","girl","girl","girl","girl","girl","girl","girl","girl","girl","girl","girl","girl","girl","girl","girl","girl","girl","girl","girl","girl","girl","boy","girl","boy","boy","girl","girl","girl","boy","boy","boy","boy","boy","girl","boy","girl","girl","girl","girl","boy","boy","boy","girl","boy","girl","girl","girl","girl","boy","girl","girl","boy","girl","boy","boy","girl","girl","girl","boy","boy","girl","boy","boy","girl","girl","boy","girl","girl","girl","girl","girl","boy","boy","boy","girl","girl","boy","boy","boy","girl","girl","boy","boy","girl","boy","boy","boy","girl","girl","girl","boy","girl","girl","girl","girl","boy","boy","girl","girl","boy","boy","boy","boy","girl","boy","girl","boy","boy","boy","girl","boy","girl","boy","girl","girl","boy","girl","girl","girl","girl","girl","girl","girl","boy","girl","girl","boy","boy","boy","girl","girl","boy","girl","boy","girl","boy","boy","boy","girl","girl","boy","girl","girl","boy","boy","girl","boy","boy","boy","boy","girl","girl","boy","boy","boy","boy","girl","boy","boy","girl","boy","boy","boy","girl","girl","girl","boy","boy","girl","boy","boy","boy","girl","boy","boy","boy","girl","girl","boy","girl","boy","boy","boy","boy","boy","girl","girl","boy","girl","girl","girl","girl","boy","boy","boy","girl","boy","boy","girl","boy","girl","boy","boy","boy","girl","boy","boy","girl","boy","boy","girl","girl","girl","girl","girl","girl","boy","boy","girl","boy","girl","girl","boy","boy","boy","girl","boy","boy","boy","girl","girl","girl","boy","boy","girl","girl","girl","boy","boy","boy","girl","boy","boy","boy","boy","boy","boy","boy","boy","boy","boy","boy","boy","boy","boy","boy","boy","boy","boy","boy","boy","boy","boy","girl","boy","girl","girl","girl","boy","girl","boy","boy","girl","girl","boy","girl","girl","boy","girl","girl","girl","girl","girl","boy","boy","boy","boy","girl","girl","boy","girl","girl","girl","boy","girl","boy","boy","girl","boy","boy","boy","girl","girl","boy","boy","boy","boy","boy","girl","boy","girl","girl","boy","boy","boy","boy","boy","girl","girl","girl","girl","girl","boy","girl","boy","boy"],[24,24,24,24,24,24,24,24,24,24,24,24,24,24,24,24,24,24,24,24,14,14,14,14,14,14,14,14,14,14,14,14,14,14,14,14,14,14,14,14,13,13,13,13,13,13,13,13,13,13,13,13,13,13,13,13,13,13,20,20,20,20,20,20,20,20,20,20,20,20,20,20,20,20,20,20,20,20,20,20,20,5,5,5,5,5,5,5,5,5,5,5,5,5,5,5,5,5,5,5,5,5,8,8,8,8,8,8,8,8,8,8,8,8,8,8,8,8,8,8,8,8,17,17,17,17,17,17,17,17,17,17,17,17,17,17,17,17,17,17,17,17,17,12,12,12,12,12,12,12,12,12,12,12,12,12,12,12,12,12,12,12,12,9,9,9,9,9,9,9,9,9,9,9,9,9,9,9,9,9,9,9,9,21,21,21,21,21,21,21,21,21,21,21,21,21,21,21,21,21,21,21,21,21,21,21,21,11,11,11,11,11,11,11,11,11,11,11,11,11,11,11,11,11,11,11,11,11,11,16,16,16,16,16,16,16,16,16,16,16,16,16,16,16,16,16,19,19,19,19,19,19,19,19,19,19,19,19,19,19,19,19,19,19,19,19,2,2,2,2,2,2,2,2,2,2,2,2,2,2,2,2,2,8,8,8,8,8,8,8,8,8,8,8,8,8,8,8,8,8,8,8,8,8,8,8,8,11,11,11,11,11,11,11,11,11,11,11,11,11,11,11,11,11,16,16,16,16,16,16,16,16,16,16,16,16,16,16,16,16,16,16,16,16,16,16,16,16,16,16,21,21,21,21,21,21,21,21,21,21,21,21,21,21,21,21,21,21,21,21,21,16,16,16,16,16,16,16,16,16,16,16,16,16,16,16,16,16,16,16,16,10,10,10,10,10,10,10,10,10,10,10,10,10,10,10,10,10,10,10,10,17,17,17,17,17,17,17,17,17,17,17,17,17,17,17,17,17,17,17,17,17,17,17,11,11,11,11,11,11,11,11,11,11,11,11,11,11,11,11,11,11,11,11,15,15,15,15,15,15,15,15,15,15,15,15,15,15,15,15,15,15,15,15,15,15,6,6,6,6,6,6,6,6,6,6,6,6,6,6,6,6,6,6,6,19,19,19,19,19,19,19,19,19,19,19,19,19,19,19,19,19,19,19,19,10,10,10,10,10,10,10,10,10,10,10,10,10,10,10,10,10,10,10,10,10,10,10,10,10,10,10,10,10,10,10,10,10,10,10,10,10,10,10,10,10,13,13,13,13,13,13,13,13,13,13,13,13,13,13,13,13,13,13,13,13,22,22,22,22,22,22,22,22,22,22,22,22,22,22,22,22,22,6,6,6,6,6,6,6,6,6,6,6,6,6,6,6,6,6,6,6,6,6,6,6,6,6,6,6,6,6,6,6,6,6,6,6,6,12,12,12,12,12,12,12,12,12,12,12,12,12,12,12,12,12,12,12,12,12,12,12,3,3,3,3,3,3,3,3,3,3,3,3,3,3,3,3,3,3,3,8,8,8,8,8,8,8,8,8,8,8,8,8,8,8,8,8,8,8,8,8,8,25,25,25,25,25,25,25,25,25,25,25,25,25,25,25,25,25,25,25,25,15,15,15,15,15,15,15,15,15,15,15,15,15,15,15,15,15,15,15,20,20,20,20,20,20,20,20,20,20,20,20,20,20,20,20,20,20,20,18,18,18,18,18,18,18,18,18,18,18,18,18,18,18,18,18,19,19,19,19,19,19,19,19,19,19,19,19,19,19,19,19,2,2,2,2,2,2,2,2,2,2,2,2,2,2,2,2,2,2,2,2,18,18,18,18,18,18,18,18,18,18,18,18,18,18,18,18,18,18,18,12,12,12,12,12,12,12,12,12,12,12,12,12,12,12,12,12,12,12,12,12,12,12,12,12,12,12,12,12,12,12,12,12,12,12,12,12,12,14,14,14,14,14,14,14,14,14,14,14,14,14,14,14,14,14,14,14,20,20,20,20,20,20,20,20,20,20,20,20,20,20,20,20,20,20,20,18,18,18,18,18,18,18,18,18,18,18,18,18,18,18,18,18,18,18,18,18,18,18,13,13,13,13,13,13,13,13,13,13,13,13,13,13,13,13,13,6,6,6,6,6,6,6,6,6,6,6,6,6,6,6,6,6,6,6,7,7,7,7,7,7,7,7,7,7,7,7,7,7,7,7,7,7,7,7,25,25,25,25,25,25,25,25,25,25,25,25,25,25,25,25,25,25,25,25,16,16,16,16,16,16,16,16,16,16,16,16,16,16,16,16,16,16,16,16,16,16,16,7,7,7,7,7,7,7,7,7,7,7,7,7,7,7,7,7,7,7,7,7,7,7,21,21,21,21,21,21,21,21,21,21,21,21,21,21,21,21,21,21,21,16,16,16,16,16,16,16,16,16,16,16,16,16,16,16,16,16,16,16,7,7,7,7,7,7,7,7,7,7,7,7,7,7,7,7,7,7,7,7,7,12,12,12,12,12,12,12,12,12,12,12,12,12,12,12,12,12,12,12,4,4,4,4,4,4,4,4,4,4,4,4,4,4,4,4,4,4,22,22,22,22,22,22,22,22,22,22,22,22,22,22,22,22,22,22,22,22,5,5,5,5,5,5,5,5,5,5,5,5,5,5,5,5,5,3,3,3,3,3,3,3,3,3,3,3,3,3,3,3,3,3,3,3,3,3,23,23,23,23,23,23,23,23,23,23,23,23,23,23,23,23,23,23,23,25,25,25,25,25,25,25,25,25,25,25,25,25,25,25,25,25,25,25,25,15,15,15,15,15,15,15,15,15,15,15,15,15,15,15,15,15,15,15,15,15,15,15,15,15,25,25,25,25,25,25,25,25,25,25,25,25,25,25,25,25,25,25,25,22,22,22,22,22,22,22,22,22,22,22,22,22,22,22,22,22,22,22,22,22,22,8,8,8,8,8,8,8,8,8,8,8,8,8,8,8,8,8,8,8,8,23,23,23,23,23,23,23,23,23,23,23,23,23,23,23,23,23,23,23,23,23,20,20,20,20,20,20,20,20,20,20,20,20,20,20,20,20,20,24,24,24,24,24,24,24,24,24,24,24,24,24,24,24,24,24,24,22,22,22,22,22,22,22,22,22,22,22,22,22,22,22,22,22,22,22,22,22,18,18,18,18,18,18,18,18,18,18,18,18,18,18,18,18,18,18,18,18,18,18,19,19,19,19,19,19,19,19,19,19,19,19,19,19,19,19,19,19,19,19,19,14,14,14,14,14,14,14,14,14,14,14,14,14,14,14,14,14,14,14,14,17,17,17,17,17,17,17,17,17,17,17,17,17,17,17,17,17,21,21,21,21,21,21,21,21,21,21,21,21,21,21,21,21,21,16,16,16,16,16,16,16,16,16,16,16,16,16,16,16,16,16,16,3,3,3,3,3,3,3,3,3,3,3,3,3,3,3,3,3,3,3,23,23,23,23,23,23,23,23,23,23,23,23,23,23,23,23,23,23,15,15,15,15,15,15,15,15,15,15,15,15,15,15,15,15,15,15,15,15,23,23,23,23,23,23,23,23,23,23,23,23,23,23,23,23,23,23,23,23,8,8,8,8,8,8,8,8,8,8,8,8,8,8,8,8,8,8,8,8,8,8,8,8,8,8,8,8,8,8,8,8,8,8,8,8,8,8,8,8,8,8,24,24,24,24,24,24,24,24,24,24,24,24,24,24,24,24,24,24,22,22,22,22,22,22,22,22,22,22,22,22,22,22,22,22,22,22,22,22,22,16,16,16,16,16,16,16,16,16,16,16,16,16,16,16,16,16,16,16,16,16,16,4,4,4,4,4,4,4,4,4,4,4,4,4,4,4,4,4,4,4,4,4,4,2,2,2,2,2,2,2,2,2,2,2,2,2,2,2,2,2,2,2,2,2,13,13,13,13,13,13,13,13,13,13,13,13,13,13,13,13,13,13,13,13,13,13,13,13,13,13,13,13,13,13,13,13,13,13,13,13,13,13,13,13,13,3,3,3,3,3,3,3,3,3,3,3,3,3,3,3,3,3,3,3,3,3,3,3,16,16,16,16,16,16,16,16,16,16,16,16,16,16,16,16,16,16,16,16,16,16,16,16,16,16,16,16,16,16,16,16,16,16,16,10,10,10,10,10,10,10,10,10,10,10,10,10,10,10,10,10,10,10,10,21,21,21,21,21,21,21,21,21,21,21,21,21,21,21,21,15,15,15,15,15,15,15,15,15,15,15,15,15,15,15,15,15,15,15,15,15,13,13,13,13,13,13,13,13,13,13,13,13,13,13,13,13,13,13,13,13,13,9,9,9,9,9,9,9,9,9,9,9,9,9,9,9,9,9,9,9,9,9,25,25,25,25,25,25,25,25,25,25,25,25,25,25,25,25,25,25,25,25,25,21,21,21,21,21,21,21,21,21,21,21,21,21,21,21,21,21,21,21,21,21,21,21,7,7,7,7,7,7,7,7,7,7,7,7,7,7,7,7,7,7,7,7],[6.3,4.9,5.3,4.7,6,4.7,5.9,4.2,5.2,3.9,5.7,4.8,5,5.5,6,5.7,3.2,3.1,6.6,4.8,6.4,2.4,3.7,4.4,4.3,4,3.8,4.2,5.1,4.1,4.6,4.9,3.1,3.2,4.4,3.7,6.1,3.5,2.9,3.3,4.2,6,4.6,4.9,4.7,4.8,2.8,6.7,4.9,6.3,5.6,3.1,3.5,4.7,4.3,4.9,5.9,2.6,4.1,5.3,6.1,6,6.3,4,5.3,5.6,5.2,6.2,6.1,3.9,4.8,5.8,4.9,6.6,5.6,4.5,5.4,4.9,5.4,6.7,6.3,4.2,4,4.7,4.7,5.2,5.8,4.4,3.8,5.9,7,7.3,5.6,5.6,6.3,4.2,4.6,6.1,5,5.8,5.5,5.3,4.1,5.8,4.2,3.9,5,4.4,4.3,3.3,3.1,6.4,3.5,5.9,4.2,3.5,4.6,5.1,4.2,4.9,3.6,2.7,5.8,4.8,4.4,1.7,3.6,3.8,4.1,5.7,2.9,4.9,5.1,4,3,4.7,2.8,3.7,5.1,3.5,4.7,6,4,6.1,3.2,3.3,5,4.2,5.6,3.9,4.5,2.2,4.2,1.5,3.2,2.7,4.1,4.8,3.5,3.6,5.5,4.8,3.5,5.2,6,5.1,5.3,6.7,3.6,3.5,3.9,4.3,4,4.6,4.5,3.6,2.6,3.9,5,4.5,7.3,6.7,2.9,5.4,6.3,3.4,4.9,5.1,7,5.4,4.9,6.6,5.8,4.4,4.9,6,4.8,3.6,5,5.5,5,5.2,5.4,6,5.7,6.1,5.2,4.7,5.5,4.8,4.9,4.6,4.6,3.4,5.6,5.4,5.6,3.2,5.1,4.4,4.8,4.2,4.3,4.2,4,1.6,4.9,3.8,4.1,3.7,4.8,4.2,5.7,4.6,3.8,2.8,4.7,5.6,2.8,3.8,2.4,5.3,3.5,4.5,4.5,4.5,6.5,6.4,6.2,6.1,5.6,6.3,6.2,6.2,5.7,5.9,5,6.1,4.5,7.2,6.3,4.8,8,6,7.7,6.1,3,3.3,5.3,3.2,3.6,4.5,1.4,2.3,2.8,4.5,3.9,4.5,3.1,4.5,2.3,6.5,3.1,4.2,3.4,4,3.1,6.3,4.4,5.5,7.9,2.9,6.4,5.1,4.3,4.3,5.8,4.5,4.5,6,5.6,4.7,4.5,4.3,3.2,5,2.9,4.2,5.6,4.5,6.3,5.1,2.8,6.3,3.1,5.4,4.7,6.5,4.5,6.8,2.9,5.1,4.2,5.1,3.7,5.2,6.3,3.9,5.3,3.7,5.8,4.6,5.9,5.8,6.6,3.7,5.8,6.2,4.8,7,5.4,7,3.3,6.7,5.6,3.5,3.6,5.1,3.7,5.3,6.1,7.8,4.8,6.7,5.1,6.8,7.1,6.7,5.6,5.1,4.8,6.7,6.7,6.9,7.9,6.6,6.9,5.7,4.4,5.7,6,7.1,5.4,6.2,7.1,4.4,3.2,5.6,6.2,4.5,5.9,5.9,3.7,7.1,5.6,5,5.9,4.8,5.7,6.8,4,6,6.5,5.9,5.1,5.8,6.9,7.2,3.3,6.6,2.7,3.1,5.7,5.6,6.3,5.9,2.9,6.3,5.7,6.3,4.2,5.4,5.7,4.2,3.5,4.6,4.1,4.2,4.6,4,4.5,4.9,5.3,3.7,3.8,5.8,3.7,5.4,6.7,4.7,6,6.3,5,5.1,5.7,5.8,7.6,7.8,5.4,5.7,6.3,6.7,7,5.6,5.5,5.4,6.7,7.3,6.1,6.5,5.8,7.1,5.9,7,5,4.8,5.9,4.5,6.3,6,6.4,3.3,4.6,5.6,4.5,6.4,3.8,6.6,6.5,5.6,5.7,4.2,6.7,3.2,5.4,4.7,3.4,2.7,3.8,3.7,7.3,6.6,3,5.2,4.7,6.2,4.5,3.3,3.9,3.4,4.1,5.3,5.6,5.3,4.5,5.1,5.6,5.6,5.9,6.5,3.7,3.9,5.7,5.7,5.1,5.7,4.6,7,4.7,3.3,4,2.9,3.8,3.7,4.3,4.1,3.7,4.1,4.1,2.8,3.2,6,3.2,3.4,3.2,4.9,3.5,3.9,3.8,2.9,3.6,6.1,5.5,6.2,2.6,4.5,2.5,6,3.6,4.8,2.9,6.2,4,4.9,5.4,4.2,4.8,6.4,3.2,5.2,3.4,4.8,4.2,3.2,4.7,4.6,4.9,4.3,3.8,4.1,5.5,5,3.6,5.4,6,4.8,4.1,4.2,5.6,4.4,4.8,3.3,4.9,3.4,3.7,4.4,5.9,3.8,5.2,6.1,5.5,7.2,6.2,7.1,6,6,5.2,6.6,5.7,6.9,6.6,5.7,4.7,3.3,2.6,5.3,4,4.7,5.2,3.5,6.5,3.9,4.9,3.6,4.3,3.5,4,7.1,6.1,4.6,4.9,5.7,5.2,7.3,3.5,4,5.8,5.8,4.4,4.6,4.2,1.5,2.9,3.2,1.8,5.5,0.4,5.4,5.1,6.2,5.9,4.9,6,4.9,3.9,4.5,4.6,2.4,4.7,5,5.8,6.1,4.6,5.2,4.8,4,3.1,4.8,7.3,3.3,4.2,6.9,7.2,8.7,5.4,9.2,7,6.4,9.5,8.1,6,7,8.1,7.4,8.4,4.7,7.4,5.7,8,8.8,6.2,5.8,3.8,8.5,4.6,3.9,3.9,4.7,5.6,3.3,5.7,4.1,4.3,5.4,4.8,3.2,4.2,3.9,6.1,4.5,3.8,6.8,5,6,7.5,7.9,7.8,7.9,7,5.5,7,6.2,7,6.6,6.8,6.8,6.8,7.4,7.5,7.1,6.7,7.3,6.7,6.3,3.9,4,3.2,4.2,5,5.3,5.3,5.7,5.2,5,3.9,5.4,7.4,4.3,6.7,4.4,5.3,5.3,4.6,6.9,6.4,6.7,4.1,4.6,5.3,7.1,6,4,4.9,4.1,4.4,4.8,4.5,3.6,5.7,6.8,7.3,3.5,3.5,4.9,4.8,5.8,5.9,5,4.3,4.6,3.6,3,4.5,3.9,4.2,6,6.5,3.4,5.4,5.6,3.6,4.7,5.7,4.8,6.4,4.9,5.3,5.5,3.9,5.1,4.8,4.6,5.2,6,6.4,5.1,7.7,7.4,6.8,6.8,8.2,7.6,7.5,6.5,4.3,7.7,7.5,6.5,8.6,5.4,4.5,3.8,6.9,6.6,5,3.4,2.5,5,3.8,3.4,3,4.4,3.6,4.2,5.3,2.9,2.8,3.7,4.2,3.2,3.6,4.1,3.2,5.3,6.6,4.1,5.5,4.8,4.5,3.9,5.9,5,7.1,5.2,7,7.3,4.1,5.5,4.9,7.2,4.1,4.4,5.3,3.6,6.7,4.2,5.6,4.7,5.6,6.2,4.7,5.4,6.7,4.8,5.5,5.6,4.3,5.2,5.9,4.5,5.7,4.2,6.7,6,6,4,5.1,4.9,3.9,4.5,3.3,4.3,6.4,5.2,6.2,5.7,3.6,5.1,5.1,3.7,4.3,7.9,4.8,7.7,6.3,4.9,5.2,7.9,6.2,6,4.8,6.2,5.6,5.1,4.5,5.5,7.1,4.8,4.9,5.5,5.5,6.1,4,3.5,3.4,6.2,5.1,3.5,6.3,6.1,5.7,3.9,5.6,3.6,5.2,8.4,3.1,5.1,6.5,4.5,5.3,3.7,5.3,5.5,5.8,3.7,5.4,4.9,4.1,5.5,6.1,3.9,5.2,4.4,4.3,3,5.9,4.4,5.5,5.8,1.8,5.5,2.1,3.6,1.9,4.4,5.1,2.5,2.6,3.6,3.4,6.1,7.4,5.2,4.5,5.3,4,4.2,5.4,5.7,3.2,6.3,4.2,4.4,5,4.3,4.2,4.7,4.1,5.4,5.2,4.8,4.9,4.5,3.5,6.9,5.3,3.4,5.2,6.7,6.8,5.6,5.6,6.5,5.1,7,6.4,6.4,7.4,5.8,6.7,5.3,5.4,7.2,5,6.3,7.6,5.9,4.2,4.9,3.1,5.1,5,5.5,3.7,3.2,5,4.8,2.4,4.1,2.4,5.9,4.3,4,5.3,4.3,4,3.9,6.3,5.8,3.9,6,4.4,5.6,6.1,5,2.9,3.4,3.2,4.7,5.1,5.4,4.2,1.9,4.4,4.5,3.6,5.4,3.9,3.4,4.5,6,3.6,4.2,6.8,7.2,6.2,7.5,7.1,6.7,7,6.5,8.4,6.2,5.3,5.3,5.5,7.4,6.9,7.5,6.8,5.1,6.6,6,4.7,5.6,3.6,3.4,4.7,6.6,4.6,4.5,5.5,5.3,5.4,4.8,5.6,6,6.8,3.8,6.7,5.8,2.7,5,4.4,2.2,4.5,2.4,2.7,3.8,4.5,4.5,4.1,3.4,2.4,4.1,5,3.8,3.9,3.4,4.4,2.3,2,4.9,2.4,4.4,3.4,3.9,4.4,6.1,3.9,6.3,4.9,5.9,6,6.5,4,4,5.7,3.6,3.9,6,4.8,6.7,2.8,4.9,5.4,3.9,2.1,3.1,3.5,2.1,5,4.8,2.2,5.1,1.2,4.9,4.8,3,5.7,6.5,6.4,8.1,5.1,4.1,6.3,5.2,7,5.6,6.5,4,7,4.5,6.7,7.5,7,7,5.7,4.6,2.9,4.8,5.8,3.1,4.3,4.1,2.8,5,5.1,4.7,3.4,1.8,4.1,6.1,4.6,3.9,4.8,2.8,6.4,5.6,5.7,5.5,4,5.3,3.7,4.5,3,6,3.6,5.7,5.1,6.1,5.9,4.2,1.6,2.7,3.3,1.4,6.2,5.9,5.6,4.8,5.5,5.5,4.4,7.1,4.3,6.3,8.2,4.4,7.5,5.3,5.9,6.4,5.7,5.1,5.7,6.6,5,4.9,5.4,4.9,5.8,8.4,6.5,4.8,6.7,6,5.2,4.7,5.4,4.7,6.9,5.2,4.8,7.5,4.8,7.7,4.8,5.1,3.4,5.5,4.6,4.8,5.3,4.6,5.4,6.1,5.8,5.5,4.6,6.4,6.5,4.2,4.6,3.1,6.8,7.1,5.5,6.9,4.6,4,6.3,6.9,5.6,8.8,5.7,8.2,8.1,6.6,6.9,5.7,8.8,7.6,9.1,7.7,6,7.4,5.6,8.9,6.4,6,6.6,5.3,6.4,5.6,6.8,5.3,5.1,5.3,6.4,8.5,5.7,5.2,7.5,6.7,7.3,5.1,4.7,5.1,7.4,7.9,7,7.5,6.9,4.5,4,6.2,5.2,7,6.3,5.5,6.6,4.6,5.3,6.4,6.5,7.4,6.7,4.9,5.1,8.6,4.5,5.9,8.1,5.9,6,8.3,5.8,5.5,5.9,8.2,6.9,6.7,6.4,6.4,5.5,7.3,6.7,5.6,7.4,5.3,6.7,6.8,6.5,6.3,5.2,6.8,4.8,7.5,5.8,5.9,6.7,6.3,4.6,4.7,5.5,5.7,4.7,5.2,4,5,5.4,5.3,6.6,5.9,4.1,5.6,5.9,4.7,6.2,4.7,4.9,5.3,6.6,5.1,7.5,7.1,7.1,4.9,4.1,5,4.2,6.5,7.4,5,6.1,4.4,5.6,4.9,5.3,3.1,4.3,5.8,3.1,5.5,5.8,4.9,2.9,4.1,3,5.1,3.6,4,4.9,3.9,4.4,6.9,2.8,5.5,3.7,5.6,5.2,2.6,5.3,4,3.9,1.7,5.8,4.8,6,4.9,5.3,6.3,5.9,5.5,5.6,4.4,7.3,8.4,4.9,4.8,5.7,6,6.1,6.1,6.7,4.5,6.5,5.9,6.9,4,5.8,4.7,6.2,6.7,5.4,5,4.2,5.3,4.4,6.2,3.8,6.3,4.5,5.6,3.3,5.2,4.1,5.1,6.3,6.8,4,6.9,4.8,5.7,4.7,5.1,5.3,3.3,6.6,4.7,4.2,5.9,4.6,6.4,3.8,4.3,5.6,4.4,5.4,8.1,6,7.5,5.8,7.5,7.5,6.4,5.7,6.5,6.8,5.8,7.1,6.4,7.9,8.1,6.6,4,4.5,3.5,5.2,5.5,5,5.1,3.8,6,4,3.2,6.1,4.5,3.6,5.2,4.8,3.9,4.4,6,5.3,5.5,6.1,6.2,2.9,5.6,4.3,6.5,4,3,4.5,3.9,3.8,2.5,3.2,4.3,6.7,4.5,3.7,5.4,5.6,5.6,3.8,6.4,4.4,7.1,4.1,3.9,3.9,5.3,5.2,5.4,5.3,3.7,4.9,6,6.7,5,4,4.7,7.4,4,3.5,4.9,3.2,6.3,6.6,5.5,5.9,4.8,7.4,4.2,5.5,5.9,4,4.3,4.2,5.2,2.7,5.8,4.7,2,4.5,5.4,5.4,3.5,5.3,2.8,5.3,4.6,3.8,3.6,3.7,4.6,3.7,5.6,2.4,4.6,3.9,4.8,6,3.7,4.1,4.5,4.8,3.3,3.9,5.2,4.9,6,2.7,2.7,4.4,4.6,5.3,4.1,4.5,1.4,2.8,2.5,4.2,3.1,1.1,4.2,2.4,0,2.5,1.7,1.9,0.9,1.8,3.6,3.7,4,4.3,1.3,3.2,3.9,5.7,6.3,6.1,5.7,7,5.4,7.6,6.4,5.9,4.5,6,7.1,6.2,6.7,5,7.6,5.3,5.9,5.6,4.9,7.1,8.1,6.2,6.6,6.4,5,5.6,7.5,6.5,5.6,5.3,7.3,6.6,6.2,5.8,7.6,7.1,6.6,4.3,6.8,6,5.1,7.8,7.8,5.5,6.8,5.2,6.4,7.7,6.6,4.7,6.5,7.1,6.3,7,5.4,6.1,6.5,6,7.4,6.7,2.4,5.6,4.7,4.3,4.1,4.6,4.6,3.2,2.2,3,4.3,2.9,5.6,2.9,4.3,5.2,6.2,3.5,3.7,2.9,2,5,2.9,6.1,7,7.3,6.2,6.1,5.4,6.9,4.1,6.1,2,3.5,7.1,6.4,5.9,5.5,5.6,7.7,4.6,4.4,6.4,5.5,3.8,6,5.9,5.7,3.3,5.1,2.7,4.7,4.4,6.4,4.3,3.3,3.1,2.5,5.3,6.2,4.6,5,6.1,4,3.6,3.3,4.5,5.8,5.7,5,5.5,6.9,5.7,6.2,4,3.4,6.8,6,5.4,2,3.2,4.9,5.2,4.1,6.5,4.2,5.4,4.9,4.1,5.1,7.1,3.8,5,6.3,4.9,5.9,6.2,5.2,6.2,7.7,6.5,4.9,5.1,5,5.7,5.3,5.6,4.6,5,5.7,4,4.9,4,7.7,3.8,6.1,4,5.9,5.1,3.5,7.1,5.2,4.8,4.2,5.4,4.4,4.2,3,4,3.8,4.8,4,5,2.1,3.4,5.2,4.8,3.8,5.9,3.5,4,2.8,5.2,5.7,5.1,4.5,4.4,5.9,6.6,3,4,4.3,4.2,5.2,3.3,5.6,6.1,2.8,4.4,3.4,3.6,4.4,4,5.6,6,6.6,6.3,5.7,6.1,5.3,5.7,4.9,4.1,4,6,3.9,4.7,7.2,4.4,4.9,4.1,5,4.1,4.9,3.1,4.1,5.1,5.3,4.5,5.7,7.5,5.3,6.3,5.8,5.9,4.9,3.9,5.4,4.3,6.1,6.7,3.9,5,6.4,7,4.5,4.6,4.4,4.9,7.4,4.9,7.1,5.4,5,6,5,3.2,4.7,4,7.2,4.2,4.3,2.5,2.1,2.8,3.4,3.4,2.9,4.1,3.6,2.2,2.6,3,3.6,1.6,4.9,2.6,6.2,5.5,4.3,3.3,5.8,5.9,4.9,5.3,6.7,6.4,6.1,7.1,4.6,5.7,7.2,8.2,5.6,7.3,6.5,5.5,6.7,6.1,6.8,7.2,6.5,3.4,5.1,3.5,3.8,4.5,4.2,5.3,6.2,5.2,8,4.4,7.4,4.1,5,5.8,4.4,2.9,3.5,5.4,5.9,4.6,4.8,4.2,3.9,3.7,6.1,1.7,5.9,6.1,4.3,3.9,1.1,1.4,1.9,4.9,6.5,3.7,5.2,4.3,2.6,6.7,2.9,5.3],[6,5,6,5,6,5,5,5,5,3,5,5,5,6,5,5,2,3,7,4,6,3,4,4,4,4,5,5,4,4,5,3,4,3,5,4,6,5,3,3,4,6,5,4,3,4,3,5,5,6,6,3,4,5,4,5,6,2,4,5,7,6,7,5,7,6,6,7,5,4,4,5,6,7,6,5,6,5,4,7,6,5,4,5,5,4,5,6,5,5,7,6,6,6,7,4,5,5,5,5,6,5,4,6,4,4,4,4,5,4,4,7,3,5,5,3,5,5,3,5,4,3,5,4,4,2,3,4,3,6,4,6,4,3,4,5,4,4,5,3,4,6,5,6,3,3,5,5,5,3,4,3,4,2,3,3,4,4,3,4,5,5,2,5,5,5,6,7,4,4,4,5,4,4,4,4,3,5,5,6,6,7,4,5,5,3,5,7,6,4,4,6,6,6,5,6,3,3,6,5,4,5,7,6,6,5,5,5,5,5,5,3,5,3,7,5,5,5,6,4,6,4,3,3,5,2,5,4,4,3,5,4,7,4,4,3,5,5,4,2,4,5,4,3,4,5,6,5,6,6,7,7,7,7,6,6,5,7,5,7,7,5,8,6,7,7,3,4,6,3,5,6,2,3,3,4,4,6,4,5,2,6,3,2,4,2,1,6,5,5,8,4,6,6,4,5,6,5,4,6,5,5,4,3,3,5,3,4,5,5,6,5,2,6,4,5,5,6,4,5,4,4,4,5,4,5,5,5,5,5,6,5,6,6,7,3,5,6,5,6,4,6,3,6,6,4,3,5,4,4,6,8,5,6,6,7,6,7,7,7,5,6,7,7,7,8,6,6,6,5,6,8,5,6,7,5,4,5,6,4,6,7,4,6,7,5,6,5,5,6,4,5,6,6,5,5,6,8,5,7,3,3,6,5,5,6,4,5,6,6,5,5,6,5,5,4,4,5,5,5,4,6,6,4,4,7,2,5,6,4,6,6,5,6,6,4,6,7,6,5,5,7,7,5,4,5,7,8,6,7,6,8,6,8,4,6,7,5,7,5,5,5,4,6,5,6,4,6,6,6,6,4,6,4,6,4,3,2,4,5,6,7,4,5,4,5,5,3,3,3,5,6,4,6,4,5,6,5,6,6,4,4,5,4,4,6,5,6,5,4,4,4,4,3,4,5,4,5,4,3,4,6,3,2,3,5,4,4,5,4,2,6,6,6,4,5,3,4,4,5,4,6,4,5,6,4,5,6,4,5,4,5,4,4,5,4,4,4,3,4,7,4,4,6,5,5,6,4,5,5,6,3,6,3,3,4,7,6,5,6,5,6,6,6,6,5,5,4,6,7,6,6,5,4,4,3,3,4,5,4,6,4,4,4,4,4,4,7,6,5,5,7,5,6,4,5,6,6,4,5,3,1,2,4,1,5,1,4,4,6,6,5,7,5,5,4,5,3,4,6,5,6,4,5,4,4,2,5,8,3,4,7,7,8,5,8,7,7,9,7,7,8,10,7,8,6,7,5,8,8,7,4,3,8,5,5,4,4,6,4,5,5,4,5,5,4,4,5,6,5,3,6,5,7,7,9,7,7,8,8,7,7,7,6,7,6,9,8,8,8,5,6,7,6,5,4,4,5,5,4,6,5,6,5,5,4,7,5,7,5,4,4,4,5,8,7,4,6,7,7,5,2,6,4,5,5,5,4,5,7,7,4,4,5,6,6,5,4,4,5,3,2,5,4,5,6,7,4,5,5,4,4,6,5,7,6,7,5,4,5,4,4,5,7,8,4,7,6,7,8,8,7,8,6,4,7,7,7,7,4,5,4,6,5,4,3,1,6,3,3,4,4,4,4,5,2,3,4,4,3,3,4,2,6,8,5,4,5,5,5,5,5,7,5,7,6,5,5,4,6,5,5,5,4,7,4,5,5,6,6,6,4,6,5,6,5,4,5,5,4,5,4,6,5,5,4,5,4,4,5,3,5,5,4,6,6,4,6,4,3,5,7,5,7,6,5,4,7,6,7,6,6,5,5,5,5,6,6,5,5,6,7,3,5,3,6,5,4,5,6,6,5,6,4,5,7,4,5,6,5,5,4,5,5,4,4,5,4,4,6,6,5,6,4,5,4,6,4,6,6,3,5,3,4,2,5,7,2,3,4,3,6,6,4,5,5,4,3,5,6,3,7,4,3,4,4,4,5,5,6,6,3,4,5,3,7,4,4,6,7,7,5,6,6,5,6,6,6,7,6,6,6,7,6,5,6,6,7,5,4,3,6,4,6,5,2,6,4,3,4,4,5,5,4,6,4,3,3,6,6,4,6,4,5,6,5,2,5,3,6,5,6,4,2,4,5,4,7,2,4,4,7,5,4,7,8,6,8,7,6,8,7,7,6,5,5,6,8,7,7,7,6,7,6,4,5,3,4,4,6,5,5,4,5,6,5,5,7,7,4,7,5,3,4,4,2,5,3,3,5,5,3,4,4,3,4,5,4,3,3,4,3,2,5,5,5,4,3,5,6,3,6,4,8,8,5,3,4,5,4,5,6,3,6,3,5,5,5,2,3,2,3,4,6,2,7,2,5,5,3,6,7,5,8,6,4,6,5,7,6,7,5,7,4,7,7,7,7,6,4,4,5,6,3,4,3,3,6,4,6,4,3,4,7,5,4,4,3,7,6,6,5,3,6,5,3,3,5,4,5,6,6,5,5,2,2,6,2,6,5,7,5,5,5,6,7,5,7,7,5,7,7,5,6,5,6,6,7,5,4,4,4,5,6,6,6,6,7,5,5,5,5,7,6,6,6,4,7,5,6,4,5,5,5,6,5,6,6,4,5,5,6,7,3,6,4,6,7,5,6,4,4,6,7,7,8,6,8,8,7,7,6,8,7,8,8,7,7,6,9,7,6,7,6,6,7,6,5,6,5,7,7,6,6,8,5,7,6,5,4,7,7,7,7,8,5,4,6,4,6,7,6,7,5,6,7,6,7,6,4,4,8,4,6,7,5,6,8,5,7,6,9,7,6,6,7,5,6,5,6,7,6,7,7,4,5,6,6,4,7,6,5,7,6,5,5,6,7,5,6,3,6,6,4,6,6,5,5,7,5,5,4,4,4,6,6,7,7,7,4,5,6,4,7,6,5,6,4,7,4,6,5,5,6,4,7,4,5,3,5,4,4,4,5,5,5,5,6,3,5,5,6,7,4,5,5,4,3,5,5,5,5,5,6,5,6,6,4,8,8,5,5,6,5,6,5,6,3,6,5,6,4,5,5,7,7,5,6,4,5,4,6,6,7,6,6,3,6,4,5,6,5,5,5,5,5,5,5,6,5,7,5,4,5,6,6,4,5,6,5,6,8,6,8,6,6,6,7,6,6,7,6,7,6,7,8,6,4,5,4,5,6,4,5,4,6,4,4,4,4,4,4,5,5,5,5,7,5,6,6,3,4,4,6,4,3,5,5,4,3,3,5,6,4,4,5,5,5,4,5,6,7,4,5,4,5,6,7,5,3,5,6,7,6,5,5,7,4,5,6,3,6,6,6,5,5,7,4,6,5,3,5,4,6,3,6,4,2,3,5,5,3,5,3,5,6,5,2,3,5,3,5,2,4,3,5,6,5,4,4,5,4,4,4,3,5,3,3,4,3,4,4,3,1,2,3,4,2,1,3,2,1,3,2,2,1,2,5,4,5,4,1,3,5,6,5,6,5,6,6,6,7,6,5,6,7,7,6,4,8,6,6,6,6,8,7,5,7,7,5,5,9,7,5,5,6,7,6,6,7,7,6,4,7,7,6,8,8,6,7,6,7,7,7,5,8,8,6,7,6,5,6,5,8,7,2,5,4,4,4,5,5,3,2,4,3,2,5,2,5,5,6,3,3,4,2,5,3,6,6,9,7,6,5,7,4,6,3,3,7,6,6,4,6,6,5,5,7,5,4,6,5,5,5,6,2,5,4,4,4,3,4,3,5,5,5,5,5,2,4,5,5,6,5,4,6,7,6,6,3,4,6,5,5,4,4,4,6,5,7,4,5,5,4,5,6,4,6,6,4,7,6,6,6,8,7,5,5,5,6,5,5,6,5,4,4,5,3,6,5,5,4,6,5,3,7,4,4,5,6,4,4,3,4,5,6,4,4,3,3,5,4,5,6,3,4,3,5,5,4,4,4,6,6,4,3,4,6,4,4,6,7,4,5,4,4,4,4,5,6,6,6,6,6,6,6,5,4,4,7,4,4,8,4,5,4,5,5,5,4,5,5,4,6,7,7,5,5,6,6,4,4,5,4,6,6,5,5,6,5,4,5,4,6,7,6,7,4,5,7,6,4,5,4,7,5,4,3,3,3,4,4,3,4,3,2,3,2,3,2,5,2,7,5,5,3,5,6,5,5,6,6,6,6,5,5,6,8,6,7,6,5,6,6,6,7,5,5,5,4,4,6,5,3,6,6,7,4,7,4,5,5,4,4,4,6,5,5,4,4,4,5,7,2,5,7,5,4,1,2,3,6,6,3,4,5,2,7,3,5]],"container":"<table class=\"display\">\n <thead>\n <tr>\n <th> <\/th>\n <th>pupil<\/th>\n <th>class<\/th>\n <th>extrav<\/th>\n <th>sex<\/th>\n <th>texp<\/th>\n <th>popular<\/th>\n <th>popteach<\/th>\n <\/tr>\n <\/thead>\n<\/table>","options":{"columnDefs":[{"className":"dt-right","targets":[1,2,3,5,6,7]},{"orderable":false,"targets":0}],"order":[],"autoWidth":false,"orderClasses":false}},"evals":[],"jsHooks":[]}</script> ] --- class: clear, center <!-- --> ??? Exaplain the graph, and ask for their observations Girls are more popular; popularity related to both extraversion and teacher experience --- class: clear 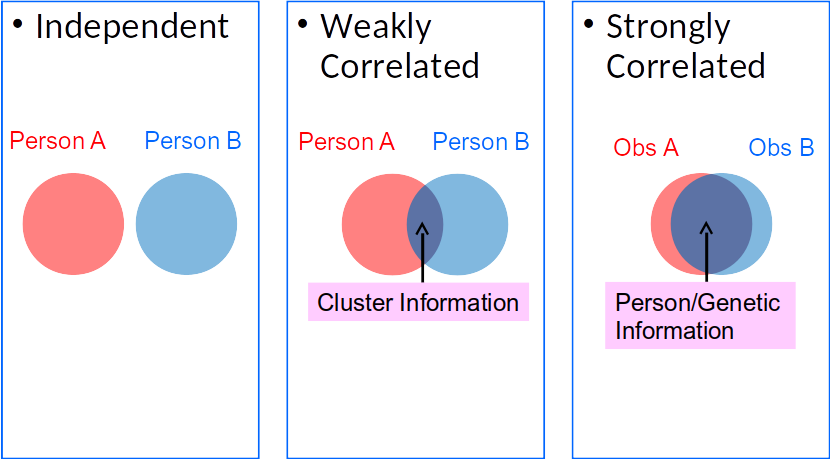 ??? Have you learned what the independent observation assumption is? When I first learn regression, I don't really know what it means until I learn MLM --- # Quantify Clustering Intraclass correlation: `$$\mathrm{ICC} = \frac{\sigma^2_\text{cluster}} {\sigma^2_\text{cluster} + \sigma^2_\text{individual}}$$` ICC = prop. var at cluster level = average correlation between two individuals in the same cluster Variance components: `\(\sigma^2_\text{cluster}\)`, `\(\sigma^2_\text{individual}\)` ??? What does the formula looks like? `\(R^2\)` --- class: clear Check the variability of (a) classroom means and (b) within a classroom .pull-left[ <!-- --> ] .pull-right[ \\(\hat\sigma^2_\text{cluster} = 0.702\\) \\(\hat\sigma^2_\text{individual} = 1.222\\) `\begin{align*} \mathrm{ICC} & = \frac{0.702} {0.702 + 1.222} \\ & = .365 \end{align*}` What does that mean? ] ??? Graph: within and between variance 36.5% variance of `popular` is at class level. Also, the average correlation of the popularity score of two students is .365 --- # Dependent (Correlated) Observations With clustered data, an assumption of OLS regression is violated One score inform another score in the same cluster Overlap: reduces effective information (\\(N_\text{eff}\\)) in data .center[  ] ??? Two students in the same class give less than two pieces of information --- # Consequences Assuming independent obs, OLS understates the uncertainty in the estimates - _SE_ too small; CI too narrow `$${\uparrow}\, t = \frac{\hat\beta}{\mathit{SE}(\hat \beta)\, \downarrow}$$` ??? What's the consequence of an inflated test statistic? --- # Comparing OLS with MLM .code30[ .pull-left[ ``` ## ## Call: ## lm(formula = popular ~ texp, data = popdata) ## ## Residuals: ## <Labelled double>: popularity sociometric score ## Min 1Q Median 3Q Max ## -4.694 -0.899 -0.063 0.906 5.112 ## ## Labels: ## value label ## 0 lowest possible ## 10 highest possible ## ## Coefficients: ## Estimate Std. Error t value Pr(>|t|) *## (Intercept) 4.20498 0.07092 59.3 <2e-16 *** *## texp 0.06110 0.00452 13.5 <2e-16 *** ## --- ## Signif. codes: 0 '***' 0.001 '**' 0.01 '*' 0.05 '.' 0.1 ' ' 1 ## ## Residual standard error: 1.32 on 1998 degrees of freedom ## Multiple R-squared: 0.0838, Adjusted R-squared: 0.0834 ## F-statistic: 183 on 1 and 1998 DF, p-value: <2e-16 ``` ] .pull-right[ ``` ## Linear mixed model fit by REML ['lmerMod'] ## Formula: popular ~ texp + (1 | class) ## Data: popdata ## ## REML criterion at convergence: 6313 ## ## Scaled residuals: ## Min 1Q Median 3Q Max ## -3.533 -0.696 0.000 0.690 3.345 ## ## Random effects: ## Groups Name Variance Std.Dev. ## class (Intercept) 0.543 0.737 ## Residual 1.222 1.105 ## Number of obs: 2000, groups: class, 100 ## ## Fixed effects: ## Estimate Std. Error t value *## (Intercept) 4.1967 0.1861 22.55 *## texp 0.0616 0.0118 5.21 ## ## Correlation of Fixed Effects: ## (Intr) ## texp -0.909 ``` ] ] --- class: clear .pull-left[ <!-- --> OLS: 95% CI [0.052, 0.070]. ] .pull-right[ <!-- --> MLM: 95% CI [0.038, 0.085]. ] ??? Understate the uncertainty in the slopes --- # Type I Error Inflation  Depends on _design effect_: 1 + (cluster size - 1) × ICC What's the design effect for the popularity data? ??? ICC of .20, _n_ = 25, `\(\alpha\)` inflated from .05 to .50 Give time to calculate the design effect --- class: clear Lai and Kwok (2015): MLM needed when __design effect > 1.1__ For the popularity data, design effect = 1 + (20 - 1) × .365 = 7.934 \\(N_\text{eff}\\) reduces by almost 8 times: 2000 → 252 --- # Random Coefficient Model For lv-2 predictor, OLS generally results in underestimated _SE_ For lv-1 predictor, in addition to problem on _SE_, OLS result does not show heterogeneity across groups --- # OLS With All Data Consider `extrav` --> `popular` (with `extrav` mean centered) <img src="intro_mlm_files/figure-html/p-1.svg" style="display: block; margin: auto;" /> --- # Think About Just One Classroom `$$\texttt{popular}_i = \beta_0 + \beta_1 \texttt{extrav}_i + e_i$$` <img src="intro_mlm_files/figure-html/p1-1.svg" style="display: block; margin: auto;" /> ??? Ask them to point out where `\(\beta_0\)`, `\(\beta_1\)`, and `\(e_i\)` are --- # Think About Just One Classroom `$$\texttt{popular}_{i\color{red}{1}} = \beta_{0\color{red}{1}} + \beta_{1\color{red}{1}} \texttt{extrav}_{i\color{red}{1}} + e_{i\color{red}{1}}$$` <img src="intro_mlm_files/figure-html/unnamed-chunk-10-1.svg" style="display: block; margin: auto;" /> --- # Think About Classroom 35 `$$\texttt{popular}_{i\color{blue}{35}} = \beta_{0\color{blue}{35}} + \beta_{1\color{blue}{35}} \texttt{extrav}_{i\color{blue}{35}} + e_{i\color{blue}{35}}$$` <img src="intro_mlm_files/figure-html/p2-1.svg" style="display: block; margin: auto;" /> --- # Classroom 14 `$$\texttt{popular}_{i\color{green}{14}} = \beta_{0\color{green}{14}} + \beta_{1\color{green}{14}} \texttt{extrav}_{i\color{green}{14}} + e_{i\color{green}{14}}$$` <img src="intro_mlm_files/figure-html/p3-1.svg" style="display: block; margin: auto;" /> --- class: clear ## OLS Lines for 100 Classrooms + Average Line `$$\texttt{popular}_{i\color{purple}{j}} = \beta_{0\color{purple}{j}} + \beta_{1\color{purple}{j}} \texttt{extrav}_{i\color{purple}{j}} + e_{i\color{purple}{j}}$$` <img src="intro_mlm_files/figure-html/unnamed-chunk-11-1.svg" style="display: block; margin: auto;" /> --- # Partial Pooling For each classroom, `\(n = 10\)` for OLS For average line, `\(N = 1,000\)` MLM with __partial pooling__: weighted average of the OLS line and the average line - Borrowing information from other clusters ??? Which one should you trust more? Get more stable estimates of regression lines --- class:clear .pull-left[ OLS <!-- --> ] .pull-right[ MLM <!-- --> ] ??? What's the difference in the individual slopes across the two graphs? --- class:clear `\(\beta_{0j}\)` and `\(\beta_{1j}\)` assumed to come from normal distributions - `\(\beta_{0j} \sim \mathcal{N}(\gamma_{00}, \sigma^2_{u_0})\)` - `\(\beta_{1j} \sim \mathcal{N}(\gamma_{10}, \sigma^2_{u_1})\)` .pull-left[ Fixed effects - `\(\gamma_{00}\)`: average intercept - `\(\gamma_{10}\)`: average slope ] .pull-right[ Random effects - `\(u_{0j}\)`: `\(\beta_{0j} - \gamma_{00}\)` - `\(u_{1j}\)`: `\(\beta_{1j} - \gamma_{10}\)` ] ??? Maybe write out the model --- # Fixed Effect Estimates .code50[ ```r library(lme4) m2s <- lmer(popular ~ extravc + (extravc | class), data = popdata) print(summary(m2s, correlation = FALSE), show.resids = FALSE, digits = 2L) ``` ``` ## Linear mixed model fit by REML ['lmerMod'] ## Formula: popular ~ extravc + (extravc | class) ## Data: popdata ## ## REML criterion at convergence: 5779 ## ## Random effects: ## Groups Name Variance Std.Dev. Corr ## class (Intercept) 0.892 0.94 ## extravc 0.026 0.16 -0.88 ## Residual 0.895 0.95 ## Number of obs: 2000, groups: class, 100 ## *## Fixed effects: *## Estimate Std. Error t value *## (Intercept) 5.031 0.097 52 *## extravc 0.493 0.025 19 ``` ] ??? Maybe do a software demo at this point --- # Random Effect __Variance__ Estimates .code50[ ```r library(lme4) m2s <- lmer(popular ~ extravc + (extravc | class), data = popdata) print(summary(m2s, correlation = FALSE), show.resids = FALSE, digits = 2L) ``` ``` ## Linear mixed model fit by REML ['lmerMod'] ## Formula: popular ~ extravc + (extravc | class) ## Data: popdata ## ## REML criterion at convergence: 5779 ## ## Random effects: *## Groups Name Variance Std.Dev. Corr *## class (Intercept) 0.892 0.94 *## extravc 0.026 0.16 -0.88 *## Residual 0.895 0.95 *## Number of obs: 2000, groups: class, 100 ## ## Fixed effects: ## Estimate Std. Error t value ## (Intercept) 5.031 0.097 52 ## extravc 0.493 0.025 19 ``` ] --- # `\(u_{0j}\)` and `\(u_{1j}\)` Estimates ``` ## (Intercept) extravc ## 1 0.2001 -0.02701 ## 2 -0.6723 0.09697 ## 3 -0.3316 0.05710 ## 4 0.5640 -0.09995 ## 5 -0.0822 0.02160 ## 6 -0.5466 0.08376 ## 7 -0.6626 0.06482 ## 8 -1.2502 0.20388 ## 9 -0.3227 0.07694 ## 10 0.3572 -0.08819 ## 11 -0.5219 0.05364 ## 12 -0.3201 0.03556 ## 13 1.0911 -0.16368 ## 14 -2.6237 0.37981 ## 15 -0.4743 0.09242 ## 16 -0.4342 0.03811 ## 17 0.2689 -0.02369 ## 18 1.2496 -0.19917 ## 19 0.6571 -0.08868 ## 20 0.2252 0.00109 ## 21 0.0208 -0.04727 ## 22 1.2951 -0.19229 ## 23 0.2055 -0.02418 ## 24 -0.7570 0.11494 ## 25 -0.0802 -0.01156 ## 26 -0.6955 0.10710 ## 27 -0.6002 0.11415 ## 28 -0.3705 0.01429 ## 29 1.0993 -0.18013 ## 30 -0.8285 0.10970 ## 31 -0.7244 0.20541 ## 32 -0.0804 0.05116 ## 33 1.4146 -0.13637 ## 34 -0.4552 0.10145 ## 35 1.9571 -0.32236 ## 36 0.3317 -0.11151 ## 37 0.2207 -0.01609 ## 38 -0.2848 0.04430 ## 39 0.2782 -0.06550 ## 40 -0.6091 0.14696 ## 41 -0.9680 0.12080 ## 42 0.3109 -0.02819 ## 43 0.3401 -0.07257 ## 44 -0.2972 0.06237 ## 45 0.7216 -0.12137 ## 46 0.2325 0.00589 ## 47 -0.0927 -0.01379 ## 48 -1.1785 0.20855 ## 49 -0.3443 0.05147 ## 50 1.1974 -0.20811 ## 51 -0.4365 0.04984 ## 52 -0.5582 0.06737 ## 53 1.6465 -0.23287 ## 54 0.2547 -0.07409 ## 55 -1.5050 0.19244 ## 56 -0.1070 0.00712 ## 57 -1.5458 0.24156 ## 58 1.0998 -0.12649 ## 59 -0.9428 0.14141 ## 60 -1.5338 0.25145 ## 61 0.9638 -0.12458 ## 62 0.8033 -0.13504 ## 63 0.3581 -0.04472 ## 64 2.1316 -0.30827 ## 65 1.3030 -0.22040 ## 66 0.7325 -0.05845 ## 67 1.4743 -0.22753 ## 68 0.7837 -0.13144 ## 69 0.8993 -0.14044 ## 70 0.1563 -0.05321 ## 71 -0.1695 0.02571 ## 72 0.8337 -0.13113 ## 73 0.2382 -0.01536 ## 74 0.0622 -0.01092 ## 75 1.7457 -0.28259 ## 76 -0.2655 0.03490 ## 77 -1.0844 0.18981 ## 78 0.0335 -0.03235 ## 79 0.0922 0.02359 ## 80 -0.3891 -0.00711 ## 81 -0.8835 0.13719 ## 82 -2.6132 0.35655 ## 83 1.0551 -0.16981 ## 84 1.3292 -0.19446 ## 85 1.3881 -0.23055 ## 86 -1.5313 0.21197 ## 87 -1.2088 0.18230 ## 88 -0.2786 0.04305 ## 89 -0.0727 0.03339 ## 90 -0.7018 0.11680 ## 91 0.0424 -0.02476 ## 92 -0.4476 0.06713 ## 93 -0.4874 0.08730 ## 94 0.4754 -0.08232 ## 95 0.0613 -0.04980 ## 96 0.3719 -0.04588 ## 97 -1.2084 0.21461 ## 98 1.2608 -0.20162 ## 99 0.0332 0.02905 ## 100 -1.2887 0.22907 ``` --- class: clear Heterogeneity in the slopes: OLS gives underestimated _SE_ of the average slope .font60[(Lai and Kwok, 2015)] Falsely assuming constant slopes across groups - Heterogeneity in slopes can be an important research question --- # Cross-Level Interaction Whether a class-level variable explains variations in class-specific slopes <img src="intro_mlm_files/figure-html/unnamed-chunk-17-1.svg" style="display: block; margin: auto;" /> ??? When there is heterogeneity, the next step is to ask what can account for that What do you observe from the graph? --- # Ecological Fallacy Association between two variables can be different across levels <img src="intro_mlm_files/figure-html/unnamed-chunk-18-1.svg" style="display: block; margin: auto;" /> # The third reason of using MLM --- class: clear .font90[ Class-level coefficient: `\(\hat \gamma_{01}\)` = 0.189, 95% CI [-0.083, 0.461] ] .code40[ ``` ## Inference for Stan model: stan_gpc_pv_ran_slp. ## 2 chains, each with iter=1000; warmup=500; thin=1; ## post-warmup draws per chain=500, total post-warmup draws=1000. ## ## mean se_mean sd 2.5% 50% 97.5% n_eff Rhat ## b0 5.07 0.01 0.08 4.91 5.07 5.23 236 1.00 ## b[1] 0.50 0.00 0.03 0.45 0.50 0.55 874 1.00 *## bm 0.19 0.01 0.15 -0.08 0.19 0.46 195 1.00 ## b_contextual -0.31 0.01 0.15 -0.60 -0.31 -0.03 197 1.00 ## sigma_y 0.95 0.00 0.01 0.92 0.95 0.97 1011 1.00 ## tau_y[1] 0.87 0.01 0.07 0.75 0.87 1.03 163 1.01 ## tau_y[2] 0.18 0.00 0.03 0.12 0.18 0.24 451 1.00 ## sigma_x 1.09 0.00 0.02 1.06 1.09 1.12 1621 1.00 ## tau_x 0.65 0.00 0.05 0.56 0.65 0.75 364 1.01 ## lp__ -2205.08 1.16 16.44 -2236.88 -2205.17 -2173.03 200 1.00 ## ## Samples were drawn using NUTS(diag_e) at Sat Nov 24 22:31:54 2018. ## For each parameter, n_eff is a crude measure of effective sample size, ## and Rhat is the potential scale reduction factor on split chains (at ## convergence, Rhat=1). ``` ] .footnote[ [1] With Bayesian estimation ] --- class: clear .font90[ Student-level coefficient: `\(\hat \gamma_{10}\)` = 0.501, 95% CI [0.45, 0.551] ] .code40[ ``` ## Inference for Stan model: stan_gpc_pv_ran_slp. ## 2 chains, each with iter=1000; warmup=500; thin=1; ## post-warmup draws per chain=500, total post-warmup draws=1000. ## ## mean se_mean sd 2.5% 50% 97.5% n_eff Rhat ## b0 5.07 0.01 0.08 4.91 5.07 5.23 236 1.00 *## b[1] 0.50 0.00 0.03 0.45 0.50 0.55 874 1.00 ## bm 0.19 0.01 0.15 -0.08 0.19 0.46 195 1.00 ## b_contextual -0.31 0.01 0.15 -0.60 -0.31 -0.03 197 1.00 ## sigma_y 0.95 0.00 0.01 0.92 0.95 0.97 1011 1.00 ## tau_y[1] 0.87 0.01 0.07 0.75 0.87 1.03 163 1.01 ## tau_y[2] 0.18 0.00 0.03 0.12 0.18 0.24 451 1.00 ## sigma_x 1.09 0.00 0.02 1.06 1.09 1.12 1621 1.00 ## tau_x 0.65 0.00 0.05 0.56 0.65 0.75 364 1.01 ## lp__ -2205.08 1.16 16.44 -2236.88 -2205.17 -2173.03 200 1.00 ## ## Samples were drawn using NUTS(diag_e) at Sat Nov 24 22:31:54 2018. ## For each parameter, n_eff is a crude measure of effective sample size, ## and Rhat is the potential scale reduction factor on split chains (at ## convergence, Rhat=1). ``` ] .footnote[ [1] With Bayesian estimation ] --- class: clear .font90[ Contextual effect: `\(\hat \gamma_{01} - \hat \gamma_{10}\)` = -0.312, 95% CI [-0.598, -0.033] ] .code40[ ``` ## Inference for Stan model: stan_gpc_pv_ran_slp. ## 2 chains, each with iter=1000; warmup=500; thin=1; ## post-warmup draws per chain=500, total post-warmup draws=1000. ## ## mean se_mean sd 2.5% 50% 97.5% n_eff Rhat ## b0 5.07 0.01 0.08 4.91 5.07 5.23 236 1.00 ## b[1] 0.50 0.00 0.03 0.45 0.50 0.55 874 1.00 ## bm 0.19 0.01 0.15 -0.08 0.19 0.46 195 1.00 *## b_contextual -0.31 0.01 0.15 -0.60 -0.31 -0.03 197 1.00 ## sigma_y 0.95 0.00 0.01 0.92 0.95 0.97 1011 1.00 ## tau_y[1] 0.87 0.01 0.07 0.75 0.87 1.03 163 1.01 ## tau_y[2] 0.18 0.00 0.03 0.12 0.18 0.24 451 1.00 ## sigma_x 1.09 0.00 0.02 1.06 1.09 1.12 1621 1.00 ## tau_x 0.65 0.00 0.05 0.56 0.65 0.75 364 1.01 ## lp__ -2205.08 1.16 16.44 -2236.88 -2205.17 -2173.03 200 1.00 ## ## Samples were drawn using NUTS(diag_e) at Sat Nov 24 22:31:54 2018. ## For each parameter, n_eff is a crude measure of effective sample size, ## and Rhat is the potential scale reduction factor on split chains (at ## convergence, Rhat=1). ``` ] .footnote[ [1] With Bayesian estimation ] ??? Explain what a contextual effect is --- # Growth Curve Analysis Individual as "cluster" <img src="intro_mlm_files/figure-html/unnamed-chunk-21-1.svg" style="display: block; margin: auto;" /> ??? Find the overall trajectory and the variations around the overall trajectory --- # Other Forms of Clustering Three-level <div id="htmlwidget-b04f9bfdbe13730d56bb" style="width:90%;height:30%;" class="grViz html-widget"></div> <script type="application/json" data-for="htmlwidget-b04f9bfdbe13730d56bb">{"x":{"diagram":"\ndigraph boxes_and_circles {\n graph [overlap = true, fontsize = 24]\n\n node [penwidth = 0]\n # District\n AB [label=\"District 1\"]\n CD [label=\"District 2\"]\n # Schools\n A; B; C; D\n # Students\n 1; 2; 3; 4; 5; 6; 7; 8; 9; 10; 11\n\n # edges\n edge [dir = \"none\"]\n AB -> {A; B}\n CD -> {C; D}\n A -> {1; 2; 3}\n B -> {4; 5}\n C -> {6; 7; 8; 9}\n D -> {10; 11}\n}\n","config":{"engine":"dot","options":null}},"evals":[],"jsHooks":[]}</script> --- # Other Forms of Clustering Cross-classification <div id="htmlwidget-01c576b8aa92b4a84a18" style="width:90%;height:30%;" class="grViz html-widget"></div> <script type="application/json" data-for="htmlwidget-01c576b8aa92b4a84a18">{"x":{"diagram":"\ndigraph boxes_and_circles {\n graph [overlap = true, fontsize = 24]\n\n node [penwidth = 0]\n # District\n n1 [label=\"Neighborhood 1\"]\n n2 [label=\"Neighborhood 2\"]\n n3 [label=\"Neighborhood 3\"]\n # Schools\n A; B; C; D\n # Students\n 1; 2; 3; 4; 5; 6; 7; 8; 9; 10; 11\n\n # edges\n edge [dir = \"none\"]\n A -> {1; 2; 3}\n B -> {4; 5}\n C -> {6; 7; 8; 9}\n D -> {10; 11}\n {1; 4; 5} -> n1\n {2; 3; 6; 7} -> n2\n {8; 9; 10; 11} -> n3\n}\n","config":{"engine":"dot","options":null}},"evals":[],"jsHooks":[]}</script> Partial Nesting <div id="htmlwidget-f6bc9c1e8c43e5023c21" style="width:90%;height:20%;" class="grViz html-widget"></div> <script type="application/json" data-for="htmlwidget-f6bc9c1e8c43e5023c21">{"x":{"diagram":"\ndigraph boxes_and_circles {\n graph [overlap = true, fontsize = 24]\n\n node [penwidth = 0]\n # Schools\n A; B; C\n D [style = invis]\n # Students\n 1; 2; 3; 4; 5; 6; 7; 8; 9; 10; 11\n\n # edges\n edge [dir = \"none\"]\n A -> {1; 2; 3}\n B -> {4; 5}\n C -> {6; 7} \n D -> {8; 9; 10; 11} [style = invis]\n}\n","config":{"engine":"dot","options":null}},"evals":[],"jsHooks":[]}</script> --- # Additional Resources Chapter from Cohen, Cohen, West, et al. (2003) Book by [Hox, Moerbeek, and Van de Schoot (2018)](https://multilevel-analysis.sites.uu.nl/) (textbook for the Spring 2019 class) Book by [Raudenbush and Bryk (2002)](https://www.amazon.com/Hierarchical-Linear-Models-Applications-Quantitative/dp/076191904X) (more technical reference) Book by [Gelman and Hill (2007)](http://www.stat.columbia.edu/~gelman/arm/) Paper by [Enders and Tofighi (2007)](http://psycnet.apa.org/doiLanding?doi=10.1037/1082-989X.12.2.121) on centering --- # Bibliography .font70[ Aitkin, M. and N. Longford (1986). "Statistical modelling issues in school effectiveness studies". In: _Journal of the Royal Statistical Society. Series A (General)_ 149, pp. 1-43. DOI: [10.2307/2981882](https://doi.org/10.2307/2981882). Cohen, J, P. Cohen, S. G. West, et al. (2003). _Applied multiple regression/ correlation analysis for the behavioral sciences_. 3rd ed. Mahwah, NJ. Enders, C. K. and D. Tofighi (2007). "Centering predictor variables in cross-sectional multilevel models: A new look at an old issue.". In: _Psychological Methods_ 12, pp. 121-138. DOI: [10.1037/1082-989X.12.2.121](https://doi.org/10.1037/1082-989X.12.2.121). Gelman, A. and J. Hill (2007). _Data analysis using regression and multilevel/hierarchical models_. Cambridge, UK: Cambridge University Press. Hox, J. J, M. Moerbeek and R. Van de Schoot (2018). _Multilevel analysis: Techniques and applications_. 3rd ed. New York, NY: Routledge. ] --- class: clear .font70[ Lai, M. H. C. and O. Kwok (2015). "Examining the rule of thumb of not using multilevel modeling: The “design effect smaller than two” rule". En. In: _The Journal of Experimental Education_ 83.3, pp. 423-438. DOI: [10.1080/00220973.2014.907229](https://doi.org/10.1080/00220973.2014.907229). Leeuw, J. de and I. Kreft (1986). "Random coefficient models for multilevel analysis". In: _Journal of Educational Statistics_ 11, pp. 57-85. DOI: [10.2307/1164848](https://doi.org/10.2307/1164848). Littell, R. C, G. A. Milliken, W. W. Stroup, et al. (1996). _SAS System for mixed models_. Cary, NC: SAS. Raudenbush, S. W. and A. S. Bryk (2002). _Hierarchical linear models: Applications and data analysis methods_. 2nd ed. Thousand Oaks, CA: Sage. ] --- class: clear, center, middle, inverse # Thanks! Slides created via the R package [**xaringan**](https://github.com/yihui/xaringan). --- # .font80[(Unconditional) Random Intercept Model] .pull-left[ `popular` score of student `\(i\)` in class `\(j\)` = Mean `popular` score of class `\(j\)` + deviation of student `\(i\)` from class mean Lv-1: `\(\texttt{popular}_{ij} = \beta_{0j} + e_{ij}\)` ] .pull-right[ <!-- --> ] --- # .font80[(Unconditional) Random Intercept Model] .pull-left[ Mean `popular` score of class `\(j\)` = Grand mean + deviation of class `\(j\)` from Grand mean Lv-2: `\(\beta_{0j} = \gamma_{00} + u_{0j}\)` ] .pull-right[ <!-- --> ] --- # .font80[(Unconditional) Random Intercept Model] Overall model: `\(\texttt{popular}_{ij} = \gamma_{00} + u_{0j} + e_{ij}\)` Fixed effects `\((\gamma_{00})\)`: constant for everyone Random effects `\((u_{0j}, e_{ij})\)`: varies across clusters - Usually assumed normally distributed - Variance components: variance of random effects --- class: clear .code50[ ```r m0 <- lmer(popular ~ (1 | class), data = popdata) summary(m0) ``` ``` ## Linear mixed model fit by REML ['lmerMod'] ## Formula: popular ~ (1 | class) ## Data: popdata ## ## REML criterion at convergence: 6330 ## ## Scaled residuals: ## Min 1Q Median 3Q Max ## -3.566 -0.698 0.002 0.676 3.318 ## ## Random effects: ## Groups Name Variance Std.Dev. *## class (Intercept) 0.702 0.838 *## Residual 1.222 1.105 ## Number of obs: 2000, groups: class, 100 ## ## Fixed effects: ## Estimate Std. Error t value *## (Intercept) 5.0779 0.0874 58.1 ``` ] --- # Interpreting the Output - Estimated grand mean `\((\hat \gamma_{00})\)` = 5.078 - Estimated classroom-level variance `\((\hat \sigma^2_{u_0})\)` = 0.702 - Estimated student-level variance `\((\hat \sigma^2_e)\)` = 1.222 - ICC = .365