Internal Consistency of Multilevel Data
Cluster Means, Centering, and Construct Meanings
Mark Lai
University of Southern California
2020/11/09
Outline
Reliability in factor analysis
Such an honor to be here. Co-chairs of my dissertation are both graduates of ASU, and they would share with me how good the program at ASU is
Lineage of ASU Quant . . .
Outline
Reliability in factor analysis
Multilevel reliability
Such an honor to be here. Co-chairs of my dissertation are both graduates of ASU, and they would share with me how good the program at ASU is
Lineage of ASU Quant . . .
Outline
Reliability in factor analysis
Multilevel reliability
Issues of level-specific reliability coefficients
- Reliability of latent scores
- Cross-level invariance
- Construct meanings
Reliability indices for observed composite scores
- ω2lω2l, ωbωb, ωwωw
Such an honor to be here. Co-chairs of my dissertation are both graduates of ASU, and they would share with me how good the program at ASU is
Lineage of ASU Quant . . .
Some alternative indices I proposed to solve these limitations
Looking forward to comments and suggestions; whether I'm doing something wrong or right
Outline
Reliability in factor analysis
Multilevel reliability
Issues of level-specific reliability coefficients
- Reliability of latent scores
- Cross-level invariance
- Construct meanings
Reliability indices for observed composite scores
- ω2lω2l, ωbωb, ωwωw
Longitudinal Data?
Such an honor to be here. Co-chairs of my dissertation are both graduates of ASU, and they would share with me how good the program at ASU is
Lineage of ASU Quant . . .
Some alternative indices I proposed to solve these limitations
Looking forward to comments and suggestions; whether I'm doing something wrong or right
Importance of Reliability
- Psychological scales are not perfect
Importance of Reliability
Psychological scales are not perfect
Certain level of reliability needed
- Statistical analyses are not trustworthy when the numbers are not consistent
Image credit: Reliability by Nick Youngson CC BY-SA 3.0 Alpha Stock Images
APA Journal Article Reporting Standards (JARS)
- In the Psychometrics section (Appelbaum, Cooper, Kline, Mayo-Wilson, Nezu, and Rao, 2018), researchers were asked to
Estimate and report values of reliability coefficients for the scores analyzed (i.e., the research's sample) (p. 7)
Similar recommendations can be found in numerous journal and methodological guidelines
Reliability
Just a quick introduction on the foundational work on reliability that this research relies on.
Classical Test Theory
Lord & Novick (1968)
Observed score = True score + Error
Y=T+EY=T+E
For example, we ask students report their attitutes toward math
Classical Test Theory
Lord & Novick (1968)
Observed score = True score + Error
Y=T+EY=T+E
TT and EE independent, so
σ2Y=σ2T+σ2Eσ2Y=σ2T+σ2E
For example, we ask students report their attitutes toward math
Classical Test Theory
Lord & Novick (1968)
Observed score = True score + Error
Y=T+EY=T+E
TT and EE independent, so
σ2Y=σ2T+σ2Eσ2Y=σ2T+σ2E
Reliability ρ=σ2Tσ2Y=σ2Tσ2T+σ2E=[Corr(Y,T)]2ρ=σ2Tσ2Y=σ2Tσ2T+σ2E=[Corr(Y,T)]2
For example, we ask students report their attitutes toward math
Latent Variable/Factor Analysis
(Essential) Tau-equivalence
pp items: k=1,…,pk=1,…,p
Yk=νk+η+ϵkYk=νk+η+ϵk
When we have multiple items, we can estimate the error variance
For the true score proportion of YY, it's on the same metric/unit as the latent variable
Latent Variable/Factor Analysis
(Essential) Tau-equivalence
pp items: k=1,…,pk=1,…,p
Yk=νk+η+ϵkYk=νk+η+ϵk Var(η)=ψVar(η)=ψ, Var(ϵk)=θkVar(ϵk)=θk, ϵkϵk and ϵk′ϵk′ independent
Cov(Yk,Yk′)=ψCov(Yk,Yk′)=ψ
Unweighted (unit-weight) composite: Z=∑kYjZ=∑kYj
Variance of unweighted composite: Var(Z)=p2ψ+∑kθkVar(Z)=p2ψ+∑kθk
When we have multiple items, we can estimate the error variance
For the true score proportion of YY, it's on the same metric/unit as the latent variable
Latent Variable/Factor Analysis
(Essential) Tau-equivalence
pp items: k=1,…,pk=1,…,p
Yk=νk+η+ϵkYk=νk+η+ϵk Var(η)=ψVar(η)=ψ, Var(ϵk)=θkVar(ϵk)=θk, ϵkϵk and ϵk′ϵk′ independent
Cov(Yk,Yk′)=ψCov(Yk,Yk′)=ψ
Unweighted (unit-weight) composite: Z=∑kYjZ=∑kYj
Variance of unweighted composite: Var(Z)=p2ψ+∑kθkVar(Z)=p2ψ+∑kθk Reliability = p2ψVar(Z)p2ψVar(Z), or Cronbach's αα
When we have multiple items, we can estimate the error variance
For the true score proportion of YY, it's on the same metric/unit as the latent variable
There were different ways to justify the derivation of αα
Latent Variable
Congeneric
Yk=νk+λkη+ϵkYk=νk+λkη+ϵk
Latent Variable
Congeneric
Yk=νk+λkη+ϵkYk=νk+λkη+ϵk
- True Score Variance VTrue=∑k(λk)2ψVTrue=∑k(λk)2ψ
- Error Variance = VError=∑kθkVError=∑kθk
Composite reliability ω=VTrueVTrue+VErrorω=VTrueVTrue+VError
Latent Variable
Congeneric
Yk=νk+λkη+ϵkYk=νk+λkη+ϵk
- True Score Variance VTrue=∑k(λk)2ψVTrue=∑k(λk)2ψ
- Error Variance = VError=∑kθkVError=∑kθk
Composite reliability ω=VTrueVTrue+VErrorω=VTrueVTrue+VError
More generally, with Cov([ϵ1,ϵ2,…])=ΘCov([ϵ1,ϵ2,…])=Θ, VError=1′Θ1VError=1′Θ1
Reliability is a property of observed test scores (Z)(Z), not the latent scores (η)(η)
Multilevel Data
Lai, M. H. C. (2020). Composite reliability of multilevel data: It's about observed scores and construct meanings. Psychological Methods. Advance online publication. https://doi.org/10.1037/met0000287
Example
2007 Trends in International Mathematics and Science Study (TIMSS; Williams et al., 2009)
- 7,896 students (4th grade) from 515 schools
Positive attitudes toward math (PATM)
| Item | Wording |
|---|---|
| AS4MAMOR | Would like to do more math |
| AS4MAENJ | I enjoy learning mathematics |
| AS4MALIK | I like math |
| AS4MABOR | Math is boring (reverse-coded) |
Multilevel Reliability Not Consistently Reported
Kim et al. (2016): Only 54% reported reliability, among 39 articles using multilevel confirmatory factor analysis (MCFA)
- Usually only one reliability reported for one scale
However, discussion on multilevel reliability is not new
Multilevel Reliability
Raykov and du Toit (2005); Raykov and Marcoulides (2006)
- Two-level composite reliability
Cranford, Shrout, Iida, Rafaeli, Yip, and Bolger (2006)
- Generalizability Theory framework
- Reliability of change
Geldhof, Preacher, and Zyphur (2014)
- Level-specific reliability (within and between)
- Most popular with cross-sectional data
- Only approach discussed in Kim et al. (2016)
Geldhof et al. (2014)

Geldhof et al. (2014)

"Unconstrained" Multilevel Factor Model
jj indexes cluster
Yij=ν+λbηbj+λwjηwij+ϵijYij=ν+λbηbj+λwjηwij+ϵij
ϵij=ϵbj+ϵwijϵij=ϵbj+ϵwij Var(ηb)=ψbVar(ηb)=ψb, Var(ηwj)=ψwVar(ηwj)=ψw
Var(ϵb)=θbVar(ϵb)=θb, Var(ϵwj)=θwVar(ϵwj)=θw
Loading invariance across clusters: λwj=λwλwj=λw for all jj
No cross-level invariance
ϵϵ is the uniqueness, separated into the within and the between level
Geldhof et al. (2014)
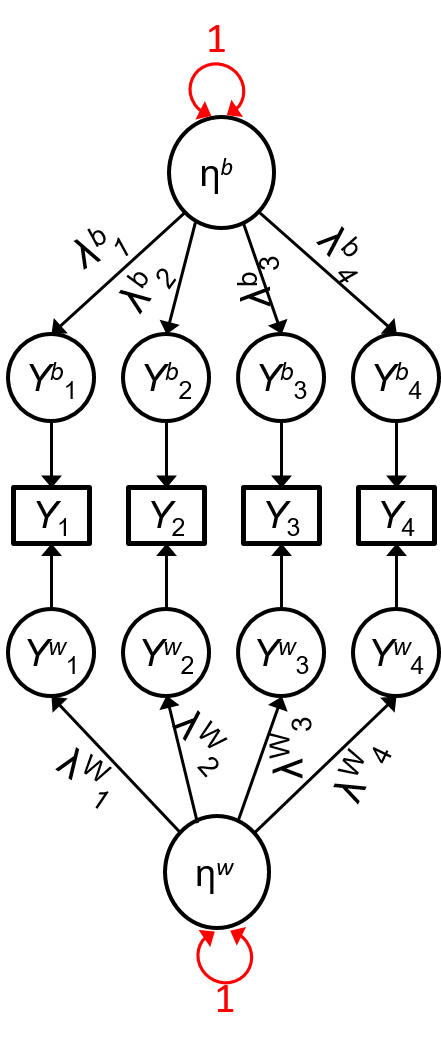
Fixed ψb=ψw=1ψb=ψw=1 for identification
˜ωb=(∑pk=1λbk)2(∑pk=1λbk)2+∑pk=1θbkk˜ωw=(∑pk=1λwk)2(∑pk=1λwk)2+∑pk=1θwkk.~ωb=(∑pk=1λbk)2(∑pk=1λbk)2+∑pk=1θbkk~ωw=(∑pk=1λwk)2(∑pk=1λwk)2+∑pk=1θwkk.
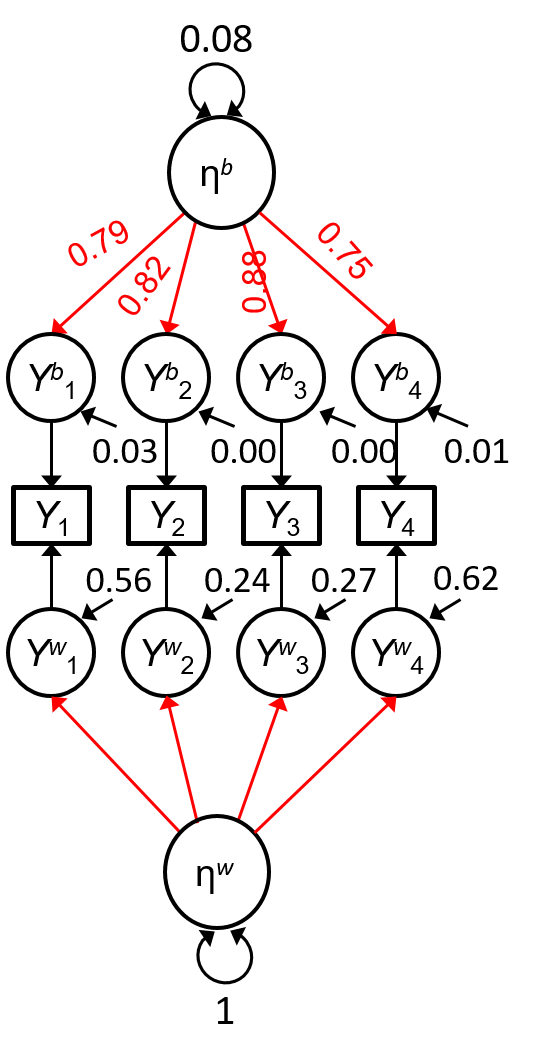
For the TIMSS data
Est ˜ωw~ωw = .857, 95% CI [.849, .863]
Est ˜ωb~ωb = .977, 95% CI [.964, .987] !!
Use tilde to distinguish them with the indices I will discuss later
Why I got interested in this is that the reliability indices seem extremely large
˜ωb~ωb is Usually High
Not uncommon in the literature . . .
˜ωb~ωb is Usually High
Not uncommon in the literature . . .
Positive and negative affects: ˜ωb~ωb = .94 to .97 (Rush and Hofer, 2014)
Instructional Skills Questionnaire: ˜αb~αb between .90 to .99 (Knol, Dolan, Mellenbergh, and van der Maas, 2016)
Repeated measures within persons
Multiple factors in ISQ, Team from Netherland
Are we that good at measuring between-level variables?
Three Issues
Which "scores" are reliable?
- Cluster means and centering
- Latent vs. observed composites
Cross-level invariance
Construct meanings
Although it is a critique on the level-specific reliability, to be fair
Three Issues
Which "scores" are reliable?
- Cluster means and centering
- Latent vs. observed composites
Cross-level invariance
Construct meanings
To be fair, most of these issues have only started getting attentions recently
Although it is a critique on the level-specific reliability, to be fair
Issue 1: "Scores" in Multilevel Studies
First compute a composite of the 4 PATM items
If we use composite PATM to predict student's math achievement, we can compute
Issue 1: "Scores" in Multilevel Studies
First compute a composite of the 4 PATM items
If we use composite PATM to predict student's math achievement, we can compute
| IDSCHOOL | AS4MAMOR | AS4MAENJ | AS4MALIK | AS4MABORr | Z | Zb | Zw |
|---|---|---|---|---|---|---|---|
| 1 | 2 | 2 | 1 | 2 | 7 | 6.5000 | 0.5000 |
| 1 | 2 | 1 | 1 | 1 | 5 | 6.5000 | -1.5000 |
| 1 | 2 | 1 | 1 | 1 | 5 | 6.5000 | -1.5000 |
| 1 | 2 | 1 | 2 | 1 | 6 | 6.5000 | -0.5000 |
| 1 | 1 | 1 | 1 | 1 | 4 | 6.5000 | -2.5000 |
| 2 | 3 | 2 | 2 | 2 | 9 | 6.5625 | 2.4375 |
| 2 | 1 | 2 | 2 | 1 | 6 | 6.5625 | -0.5625 |
| 2 | 1 | 1 | 1 | 1 | 4 | 6.5625 | -2.5625 |
| 2 | 3 | 2 | 1 | 1 | 7 | 6.5625 | 0.4375 |
| 2 | 2 | 2 | 3 | 1 | 8 | 6.5625 | 1.4375 |
Three Sets of Scores
Raw/Overall composite PATM (Zij)(Zij)
School means of composite PATM (cluster mean; ZbjZbj)
Student deviations from school means (cluster-mean centered; Zwij=Zij−ZbjZwij=Zij−Zbj)
Three Sets of Scores
Raw/Overall composite PATM (Zij)(Zij)
School means of composite PATM (cluster mean; ZbjZbj)
Student deviations from school means (cluster-mean centered; Zwij=Zij−ZbjZwij=Zij−Zbj)
We should compute reliability for each of them
Which Score Is ˜ωb~ωb for?
Is ˜ωb~ωb the reliability of the school means?
Not clear in the original paper
Which Score Is ˜ωb~ωb for?
Is ˜ωb~ωb the reliability of the school means?
Var(Yb1)=(λb1)2+θb11Var(Yb1)=(λb1)2+θb11
Var(∑kYbk)=(∑kλbk)2+∑kθbkkVar(∑kYbk)=(∑kλbk)2+∑kθbkk
˜ωb=(∑kλbk)2(∑kλbk)2+∑kθbkk~ωb=(∑kλbk)2(∑kλbk)2+∑kθbkk

Not clear in the original paper
But What is YbkYbk?
YbjkYbjk (in circle) is the latent school mean of item kk
- True/Population mean of all students of school jj
Let's say the school has 500 students. The one in circle is the mean of everyone from that school. But the sample may only contain 50 students
May be easier to think in terms of a population mean vs a sample mean
But What is YbkYbk?
YbjkYbjk (in circle) is the latent school mean of item kk
- True/Population mean of all students of school jj
Different from the observed school mean, ˉY.jk=∑nji=1Yijk/nj¯Y.jk=∑nji=1Yijk/nj
- Mean of students in the sample from school jj
Raudenbush and Bryk (2002): Reliability of cluster means
Var(Yijk−Ybjk)=σwkk/njVar(Yijk−Ybjk)=σwkk/nj
Let's say the school has 500 students. The one in circle is the mean of everyone from that school. But the sample may only contain 50 students
May be easier to think in terms of a population mean vs a sample mean
- Raudenbush & Bryk also talks about the reliability of the cluster mean, which is not perfect with a finite sample
- The observed mean converges to the latent mean when nj→∞nj→∞
Therefore, ˜ωb~ωb is the internal consistency of a latent composite.
Is that a problem?
Therefore, ˜ωb~ωb is the internal consistency of a latent composite.
Is that a problem?
Let's go back to Y=T+EY=T+E, where TT is a latent variable. What is the reliability of TT?
Therefore, ˜ωb~ωb is the internal consistency of a latent composite.
Is that a problem?
Let's go back to Y=T+EY=T+E, where TT is a latent variable. What is the reliability of TT?
It should be 1 as TT is the true score
Therefore, ˜ωb~ωb is the internal consistency of a latent composite.
Is that a problem?
Let's go back to Y=T+EY=T+E, where TT is a latent variable. What is the reliability of TT?
It should be 1 as TT is the true score
But if we know the true score, we don't need to worry about reliability
Illustration Using Simulated Data
ψb=ψw=1ψb=ψw=1, nj=10nj=10 for all jj
Five items
- λb=0.25λb=0.25, θb=0.1θb=0.1
- λw=0.5λw=0.5, θw=1θw=1
Just to make things more clear, I simulated a data set
Ten observations in each cluster
Illustration Using Simulated Data
ψb=ψw=1ψb=ψw=1, nj=10nj=10 for all jj
Five items
- λb=0.25λb=0.25, θb=0.1θb=0.1
- λw=0.5λw=0.5, θw=1θw=1

Just to make things more clear, I simulated a data set
Ten observations in each cluster
Illustration Using Simulated Data
ψb=ψw=1ψb=ψw=1, nj=10nj=10 for all jj
Five items
- λb=0.25λb=0.25, θb=0.1θb=0.1
- λw=0.5λw=0.5, θw=1θw=1
Sources of measurement error:
| Latent Mean | item uniqueness |
| Observed Mean | item uniqueness + sampling error |


ηbηb is the true score at the school level
Left: Correlation between latent score and latent composite
Right: Correlation between latent score and observed composite, which is smaller

˜ωb=.76=[Corr(ηb,∑kYbk)]2~ωb=.76=[Corr(ηb,∑kYbk)]2
ηbηb is the true score at the school level
Left: Correlation between latent score and latent composite
Right: Correlation between latent score and observed composite, which is smaller

˜ωb=.76=[Corr(ηb,∑kYbk)]2~ωb=.76=[Corr(ηb,∑kYbk)]2
However, [Corr(ηb,Zb)]2=.49[Corr(ηb,Zb)]2=.49, as
VError=∑pk=1θbkk+[(∑pk=1λwk)2+∑pk=1θwkk]/nVError=∑pk=1θbkk+[(∑pk=1λwk)2+∑pk=1θwkk]/n
ωb=.49≠˜ωbωb=.49≠~ωb
ηbηb is the true score at the school level
Left: Correlation between latent score and latent composite
Right: Correlation between latent score and observed composite, which is smaller
Overly optimistic information
imagine in a single-level context, saying that the reliability of the instrument was .76, but when it was less than .5

˜ωb=.76=[Corr(ηb,∑kYbk)]2~ωb=.76=[Corr(ηb,∑kYbk)]2
However, [Corr(ηb,Zb)]2=.49[Corr(ηb,Zb)]2=.49, as
VError=∑pk=1θbkk+[(∑pk=1λwk)2+∑pk=1θwkk]/nVError=∑pk=1θbkk+[(∑pk=1λwk)2+∑pk=1θwkk]/n
ωb=.49≠˜ωbωb=.49≠~ωb
For the TIMSS items, ωb=.719ωb=.719, 95% CI [.668, .771]
- as opposed to ˜ωb=.977~ωb=.977
ηbηb is the true score at the school level
Left: Correlation between latent score and latent composite
Right: Correlation between latent score and observed composite, which is smaller
Overly optimistic information
imagine in a single-level context, saying that the reliability of the instrument was .76, but when it was less than .5
How About ˜ωw~ωw?
How About ˜ωw~ωw?
˜ωw~ωw is composite reliability of latent-mean-centered scores
- Also latent variables
- But algebraically, ˜ωw=ωw~ωw=ωw

Issue 2: Cross-Level Loading Invariance
Without Constraints on Loadings
ηbηb: school-level construct, no connection to ηwηw
ηwηw: purely student-level construct (i.e., ICC = 0)
- E.g., PATW relative to the school mean
(See e.g., Mehta & Neale, 2005)
Can only compare relative standing, not absolute value
Without Constraints on Loadings
ηbηb: school-level construct, no connection to ηwηw
ηwηw: purely student-level construct (i.e., ICC = 0)
- E.g., PATW relative to the school mean
(See e.g., Mehta & Neale, 2005)

Can only compare relative standing, not absolute value
With Cross-Level Invariance
One construct ηη: ηij=ηbj+ηwijηij=ηbj+ηwij
ICC = ψbψb+ψwψbψb+ψw
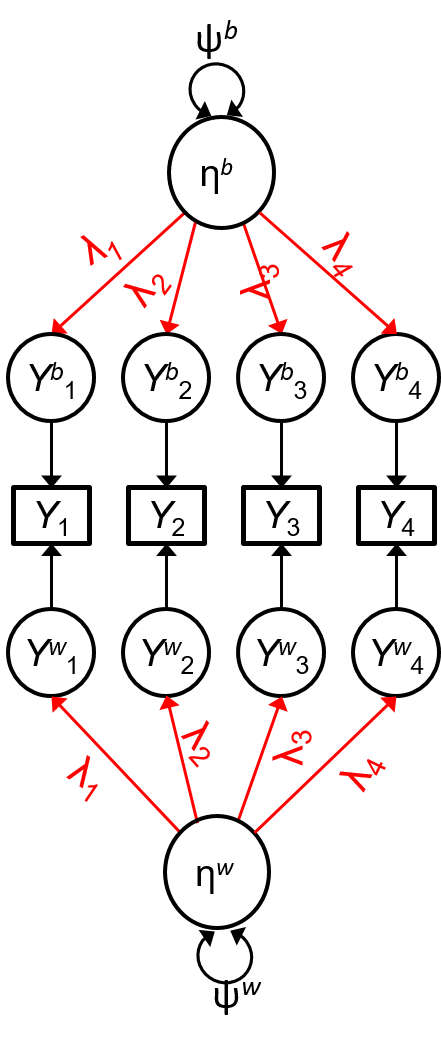
This is more consistent with the way we use cluster means and do centering in MLM
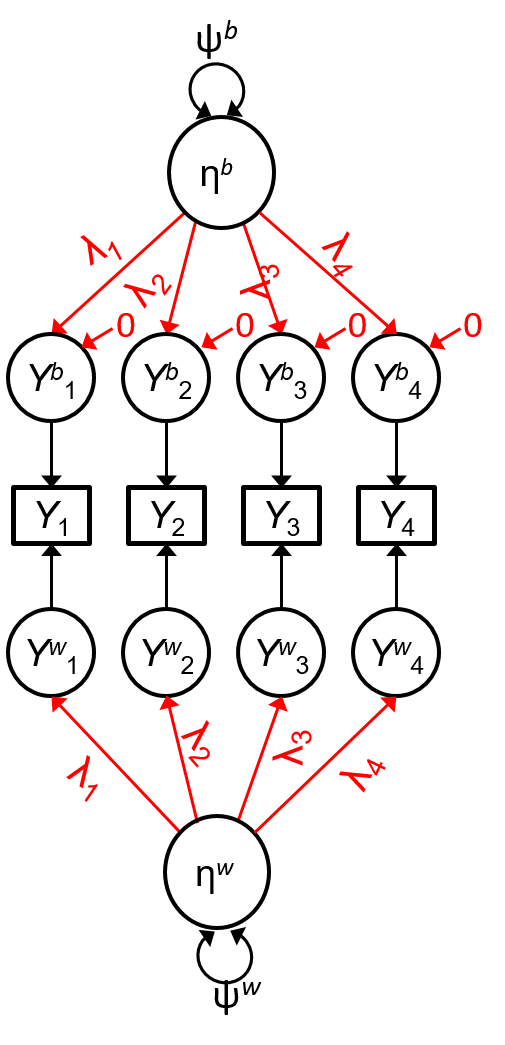
Strong/Scalar Invariance Across Clusters
Implies that θbkk=0θbkk=0 for all kks
- ⇒˜ωb=1.0⇒~ωb=1.0 (Jak, Oort, and Dolan, 2014)
For an individual construct, ˜ωb~ωb is roughly a measure of strong invariance
Construct Meanings
Based on Stapleton, Yang, and Hancock (2016); Stapleton and Johnson (2019)
What is the Target Construct?
What is your attitude toward math?
What is your attitude toward math, relative to the school norm?
What is your school's overall attitude toward math?
Individual/Configural Construct
Individual/Configural Construct
What is your attitude toward math?
Individual construct ηη
Partitioning: η=ηb+ηwη=ηb+ηw
Configural construct ηbηb (i.e., true cluster mean)
- Var(ηb)/Var(η)Var(ηb)/Var(η) = ICC
Within-cluster component ηwηw
Matching Composites and Constructs
- Individual construct--Raw composite Zij=∑kYijkZij=∑kYijk
- VTrue=(∑pk=1λk)2(ψw+ψb)VTrue=(∑pk=1λk)2(ψw+ψb)
- VError=1′Θb1+1′Θw1VError=1′Θb1+1′Θw1
- Discussed in Raykov and du Toit (2005)
Matching Composites and Constructs
- Individual construct--Raw composite Zij=∑kYijkZij=∑kYijk
- VTrue=(∑pk=1λk)2(ψw+ψb)VTrue=(∑pk=1λk)2(ψw+ψb)
- VError=1′Θb1+1′Θw1VError=1′Θb1+1′Θw1
- Discussed in Raykov and du Toit (2005)
- Configural construct--Composite cluster mean Zbj=∑kˉYjkZbj=∑k¯Yjk
- VTrue=(∑pk=1λk)2ψbVTrue=(∑pk=1λk)2ψb
- VError=1′Θb1+[(∑pk=1λk)2ψw+1′Θw1]/nVError=1′Θb1+[(∑pk=1λk)2ψw+1′Θw1]/n
- For unbalanced cluster sizes, use the harmonic mean ˜n~n
- Within-cluster construct--Composite of deviation scores Zwij=∑k(Yijk−ˉYjk)Zwij=∑k(Yijk−¯Yjk)
- VTrue=(∑pk=1λk)2ψwVTrue=(∑pk=1λk)2ψw
- VError=1′Θw1VError=1′Θw1
Replace nn with the harmonic mean for unequal cluster sizes
Within-Cluster Construct
Within-Cluster Construct
What is your attitude toward math, relative to the school norm?
Within-cluster construct ηwηw
Expected ICC = 0
ωwωw reliability of ZwijZwij
(∑pk=1λk)2ψw(∑pk=1λk)2ψw+1′Θw1(∑pk=1λk)2ψw(∑pk=1λk)2ψw+1′Θw1

Shared Construct
Shared Construct
What is your school's attitude toward math?
Shared construct ηbηb: Cluster-level attribute (aka climate)
ωbωb reliability of ZbjZbj
- VTrue=(∑pk=1λk)2ψbVTrue=(∑pk=1λk)2ψb
- VError=1′Θb1+1′Σw1/˜nVError=1′Θb1+1′Σw1/~n

Shared + Configural/Individual Constructs
Shared + Configural/Individual Constructs
What is your school's attitude toward math?
There may be rater acquiescence
Shared construct ηsηs: School climate
Individual construct ηwηw: Acquiescence
Configural construct ηbηb: School means of Acquiescence

Shared + Configural/Individual Constructs
The school-level composite, ZbjZbj, measures both ηsηs and ηbηb
ωb(s)ωb(s): construct reliability of ZbjZbj measuring ηsηs
- VTrue=(∑pk=1λsk)2ψsVTrue=(∑pk=1λsk)2ψs
- VError=(∑pk=1λk)2(ψb+ψw/˜n)VError=(∑pk=1λk)2(ψb+ψw/~n)
+1′Θb1+1′Θw1/˜n+1′Θb1+1′Θw1/~n

Extensions of αα
α2l=pp−1(∑k≠k′(σbkk′+σwkk′)1′Σb1+1′Σw1)αb=pp−1(∑k≠k′σbkk′1′Σb1+1′Σw1/˜n)αw=pp−1(∑k≠k′σwkk′1′Σw1)α2l=pp−1(∑k≠k′(σbkk′+σwkk′)1′Σb1+1′Σw1)αb=pp−1(∑k≠k′σbkk′1′Σb1+1′Σw1/~n)αw=pp−1(∑k≠k′σwkk′1′Σw1)

Which One to Report?
- If a variable is partitioned in a multilevel model (most likely an individual construct), all three (ω2l,ωb,ωw)(ω2l,ωb,ωw) should be reported
- Cluster means and cluster-mean centered predictors
- Outcome variable
Which One to Report?
- If a variable is partitioned in a multilevel model (most likely an individual construct), all three (ω2l,ωb,ωw)(ω2l,ωb,ωw) should be reported
- Cluster means and cluster-mean centered predictors
- Outcome variable
- Otherwise, reliability at the corresponding level (ωb(ωb or ωw)ωw)
Summary (Lai, 2020)
Computing and reporting reliability information is important for multilevel data
Summary (Lai, 2020)
Computing and reporting reliability information is important for multilevel data
Reliability information is needed for raw, cluster means, and cluster-mean centered scores
Summary (Lai, 2020)
Computing and reporting reliability information is important for multilevel data
Reliability information is needed for raw, cluster means, and cluster-mean centered scores
Previous approach to between-level reliability is an overestimate when cluster size is small
Summary (Lai, 2020)
Computing and reporting reliability information is important for multilevel data
Reliability information is needed for raw, cluster means, and cluster-mean centered scores
Previous approach to between-level reliability is an overestimate when cluster size is small
Nature of target construct should be considered, and it has implications on reliability computation
| Construct | ω2lω2l, α2lα2l | ωbωb, αbαb | ωwωw, αwαw | ωb(s)ωb(s) |
|---|---|---|---|---|
| Individual | X | X | X | |
| Configural | X | |||
| Within-Cluster | X | |||
| Shared | X | X |
Longitudinal Data
Preliminary ideas. Suggestions are greatly appreciated.
Midlife in the United States
Data from MIDUS 2: Daily Stress Project, 2004-2009 (Ryff and Almeida, 2009)
2,022 participants, 8 days each
Target construct: Positive affect
| Item | Wording |
|---|---|
| b2dc24 | Did you feel attentive? |
| b2dc25 | Did you feel proud? |
| b2dc26 | Did you feel active? |
| b2dc27 | Did you feel confident? |
- Type of scores: raw composite, person means, person-mean centered
From MCFA
Est ICC(η)=.778ICC(η)=.778
| Composite | Est ωω | 95% CI |
|---|---|---|
| Raw | .812 | [.801, .822] |
| Within | .609 | [.595, .623] |
| Between | .852 | [.839, .864] |
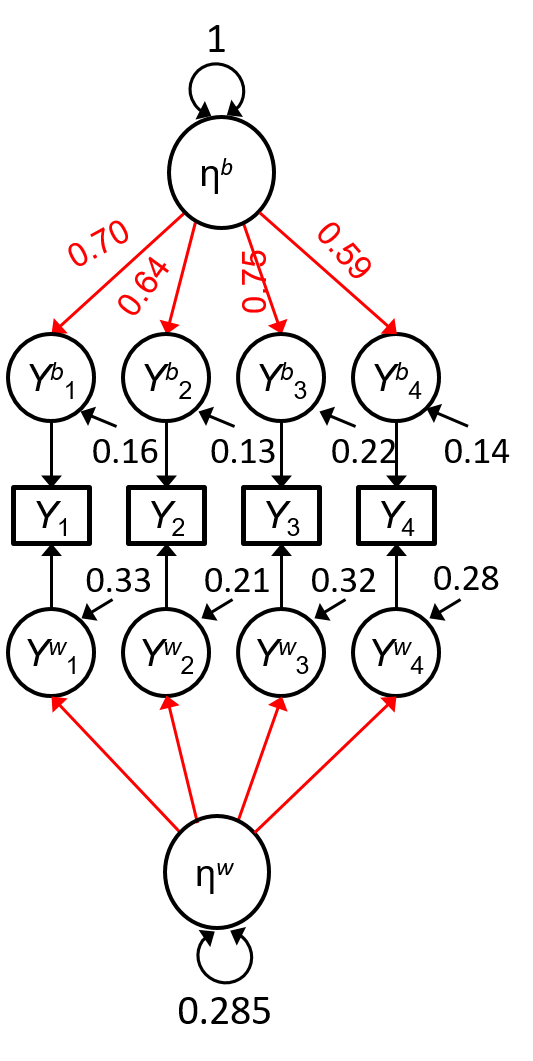
Can We Incorporate Time?
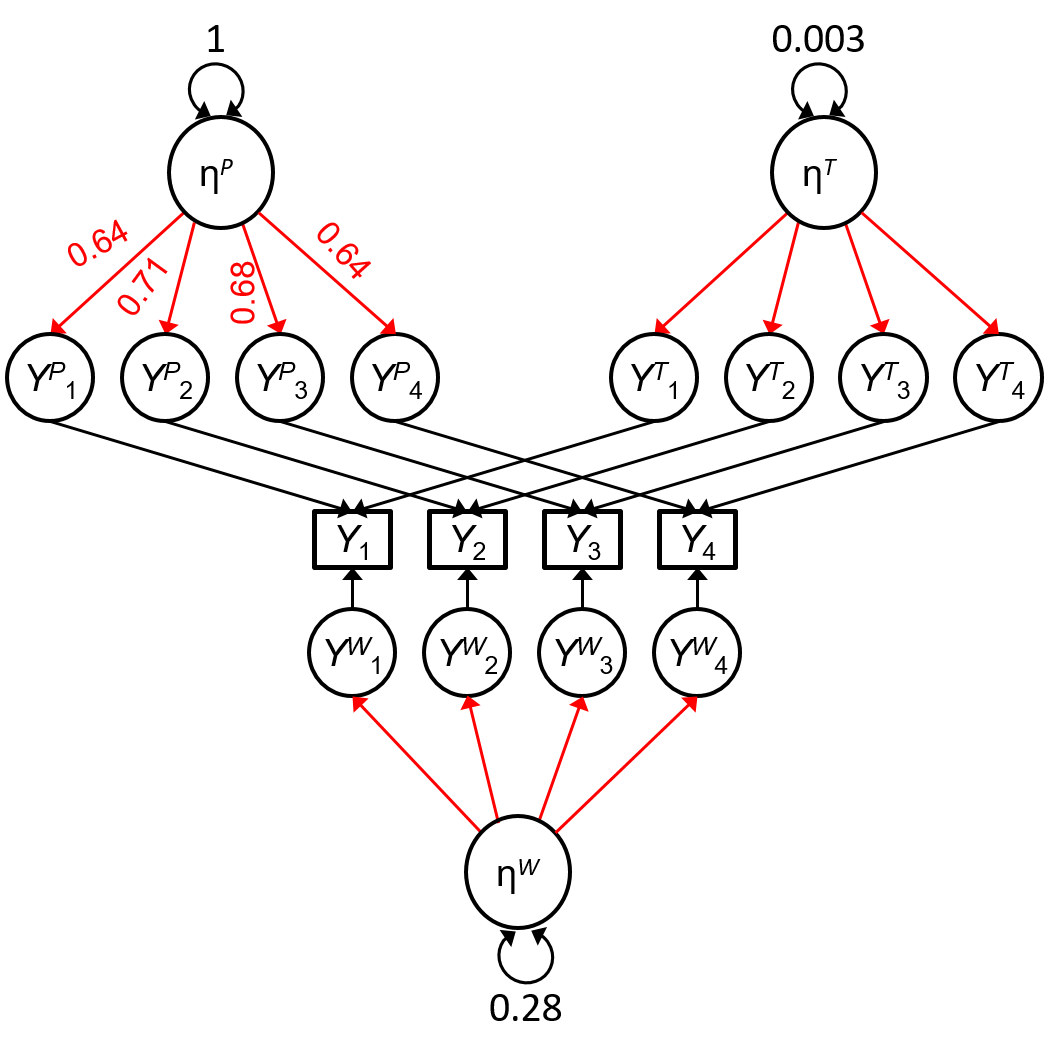
Cross-Classified CFA (Jeon and Rabe-Hesketh, 2012; Asparouhov and Muthén, 2012)
Assuming cross-level invariance for an individual construct, with decomposition ηti=ηPi+ηTt+ηWtiηti=ηPi+ηTt+ηWti
Relation to the Generalizability Theory
Most meaningful when participants are measured on the same days/times
Cranford, Shrout, Iida, et al. (2006): generalizability coefficients for diary studies
Not the case for the MIDUS data, as everyone starts on a different day
Relation to the Generalizability Theory
Most meaningful when participants are measured on the same days/times
Cranford, Shrout, Iida, et al. (2006): generalizability coefficients for diary studies
- Fixed vs. Random item facet (in estimation)
- Relax the essential parallel test assumption
- Item-specific loadings and uniqueness
- Flexible SEM modeling
Not the case for the MIDUS data, as everyone starts on a different day
Some Possible Reliability Coefficients
Reliability of raw scores
- VTrue=(∑kλk)2(ψP+ψT+ψW)VTrue=(∑kλk)2(ψP+ψT+ψW)
- VError=1′(ΘP+ΘT+ΘW)1VError=1′(ΘP+ΘT+ΘW)1
Some Possible Reliability Coefficients
Reliability of raw scores
- VTrue=(∑kλk)2(ψP+ψT+ψW)VTrue=(∑kλk)2(ψP+ψT+ψW)
- VError=1′(ΘP+ΘT+ΘW)1VError=1′(ΘP+ΘT+ΘW)1
Reliability of person means (across T time points)
- VTrue=(∑kλk)2ψPVTrue=(∑kλk)2ψP
- VError=1′ΘP1+[(∑kλk)2ψW+1′ΘW1]/TVError=1′ΘP1+[(∑kλk)2ψW+1′ΘW1]/T
Some Possible Reliability Coefficients
Reliability of raw scores
- VTrue=(∑kλk)2(ψP+ψT+ψW)
- VError=1′(ΘP+ΘT+ΘW)1
Reliability of person means (across T time points)
- VTrue=(∑kλk)2ψP
- VError=1′ΘP1+[(∑kλk)2ψW+1′ΘW1]/T
Reliability of deviation from person mean
- VTrue=(∑kλk)2(ψT+ψW)
- VError=1′(ΘT+ΘW)1
Person-level (trait-level) variance is not part of true score for the deviation score
In this example, there is essentially no time-level variance
- E.g., no day of participation effect
| Composite | Est ω | 95% CI |
|---|---|---|
| Raw | .829 | [.820, .837] |
| Within | .646 | [.635, .660] |
| Between | .859 | [.849, .868] |
Many Questions Remain
Linkage to generalizability coefficients by Cranford et al. (2006)
Discrete indicators?
Should constructs at the within-person level and the between-person level be on the same metric?
Are there "shared" constructs at the person level?
- E.g., Intensively measuring a stable trait?
Reliability of change? (Rogosa, Brandt, and Zimowski, 1982)
- Related to reliability of within-person deviation?
References
Appelbaum, M., H. Cooper, R. B. Kline, et al. (2018). "Journal article reporting standards for quantitative research in psychology". In: American Psychologist 73.1, pp. 3-25. ISSN: 0003066X. DOI: 10.1037/amp0000191.
Asparouhov, T. and B. Muthén "General random effect latent variable modeling: Random subjects, items, contexts, and parameter". In: Advances in multilevel modeling for educational research: Addressing practical issues found in real-world applications. Charlotte, NC: Information Age, pp. 163-192.
Cranford, J. A., P. E. Shrout, M. Iida, et al. (2006). "A procedure for evaluating sensitivity to within-person change: Can mood measures in diary studies detect change reliably?" En. In: Personality and Social Psychology Bulletin 32.7, pp. 917-929. ISSN: 0146-1672, 1552-7433. DOI: 10.1177/0146167206287721. URL: http://journals.sagepub.com/doi/10.1177/0146167206287721 (visited on Nov. 08, 2020).
Geldhof, G. J., K. J. Preacher, and M. J. Zyphur (2014). "Reliability estimation in a multilevel confirmatory factor analysis framework". In: Psychological Methods 19.1, pp. 72-91. ISSN: 1082989X. DOI: 10.1037/a0032138.
References (cont'd)
Jak, S., F. J. Oort, and C. V. Dolan (2014). "Measurement bias in multilevel data". In: Structural Equation Modeling: A Multidisciplinary Journal 21.1, pp. 31-39. ISSN: 1070-5511. DOI: 10.1080/10705511.2014.856694.
Jeon, M. and S. Rabe-Hesketh (2012). "Profile-likelihood approach for estimating generalized linear mixed models with factor structures". En. In: Journal of Educational and Behavioral Statistics 37.4, pp. 518-542. ISSN: 1076-9986, 1935-1054. DOI: 10.3102/1076998611417628. URL: http://journals.sagepub.com/doi/10.3102/1076998611417628 (visited on Nov. 08, 2020).
Knol, M. H., C. V. Dolan, G. J. Mellenbergh, et al. (2016). "Measuring the quality of university lectures: Development and validation of the Instructional Skills Questionnaire (ISQ)". In: PLOS ONE 11.2. Ed. by D. S. Courvoisier, p. e0149163. ISSN: 1932-6203. DOI: 10.1371/journal.pone.0149163.
Lai, M. H. C. (2020). "Composite reliability of multilevel data: It’s about observed scores and construct meanings." En. In: Psychological Methods. ISSN: 1939-1463, 1082-989X. DOI: 10.1037/met0000287. URL: http://doi.apa.org/getdoi.cfm?doi=10.1037/met0000287 (visited on Nov. 08, 2020).
References (cont'd)
Raudenbush, S. W. and A. S. Bryk (2002). Hierarchical linear models: Applications and data analysis methods. 2nd ed. Thousand Oaks, CA: Sage. ISBN: 076191904X.
Raykov, T. and G. A. Marcoulides (2006). "On multilevel model reliability estimation from the perspective of structural equation modeling". In: Structural Equation Modeling: A Multidisciplinary Journal 13.1, pp. 130-141. ISSN: 1070-5511. DOI: 10.1207/s15328007sem1301_7.
Raykov, T. and S. H. C. du Toit (2005). "Estimation of reliability for multiple-component measuring instruments in hierarchical designs". In: Structural Equation Modeling: A Multidisciplinary Journal 12.4, pp. 536-550. ISSN: 1070-5511. DOI: 10.1207/s15328007sem1204_2.
Rogosa, D., D. Brandt, and M. Zimowski (1982). "A growth curve approach to the measurement of change." En. In: Psychological Bulletin 92.3, pp. 726-748. ISSN: 0033-2909. DOI: 10.1037/0033-2909.92.3.726. URL: http://content.apa.org/journals/bul/92/3/726 (visited on Nov. 08, 2020).
References (cont'd)
Rush, J. and S. M. Hofer (2014). "Differences in within- and between-person factor structure of positive and negative affect: Analysis of two intensive measurement studies using multilevel structural equation modeling.". In: Psychological Assessment 26.2, pp. 462-473. ISSN: 1939-134X. DOI: 10.1037/a0035666.
Ryff, C. D. and D. M. Almeida (2009). Midlife in the United States (MIDUS 2): Daily Stress Project, 2004-2009: Version 2. En. type: dataset. DOI: 10.3886/ICPSR26841.V2. URL: http://www.icpsr.umich.edu/icpsrweb/NACDA/studies/26841/version/2 (visited on Nov. 08, 2020).
Stapleton, L. M. and T. L. Johnson (2019). "Models to examine the validity of cluster-level factor structure using individual-level data". In: Advances in Methods and Practices in Psychological Science, p. 251524591985503. ISSN: 2515-2459. DOI: 10.1177/2515245919855039.
Stapleton, L. M., J. S. Yang, and G. R. Hancock (2016). "Construct meaning in multilevel settings". In: Journal of Educational and Behavioral Statistics 41.5, pp. 481-520. ISSN: 1076-9986. DOI: 10.3102/1076998616646200.